- Together We Trade
- Posts
- Charts To Watch!
Charts To Watch!
Noah
August 25, 2024
Hello Traders,
Definitely not a bad close to the week. All the major indexes printing positive returns on the week with small caps taking the lead:
IWM | +3.66% |
SPY | +1.41% |
QQQ | +1.05% |
DIA | +1.25% |
NYSE is making new all-time-highs while breadth continues to expand as we keep seeing more stocks making new highs:

Tickers
LAMR, AIZ, AVY, LOW, BBY, BJ, BRX, CMRE, CUBE, DOV, ED, ELV, FCX, FR, IGV, J, KBR, META, MORN, MRO, ONON, OTIS, SCI, SHW, SKY, SLV, SPGI, SSB, STE, TMO, TTD, TNX, WHD, WSR
You may see some familiar names that have been shared in previous weeks. This is only because these charts are either still in play, or are still very close to breakout levels. As I spot charts that look to be setting up, it can often take several weeks for them to fully set up for a breakout. However, we never know when a breakout will occur, so it’s best to ensure they are continuously on your watchlist.
Let’s get right into the charts on watch for this week:
LAMR: Lamar Advertising is hovering just under resistance at $122, testing this level multiple times over the past few years. If price can breakout and close over the black line I am interested in being long.

AIZ: Assurant was shared with viewers weeks back as it was in the early stages of forming this pull-back to $160. Price has curled all the way back up to previous resistance at $189 and just this past week broke out over resistance confirming the breakout on this multi-year cup and handle pattern.

AVY: Avery Dennison with a similar pattern to AIZ before it rallied back to its upper resistance zone. I’m watching to see if price can curl higher from here. It may take some time, but could offer a good risk/reward trade if it plays out. Ultimately we are looking for a breakout over the black line to signal the breakout, but I am stalking this move early into the charts development.

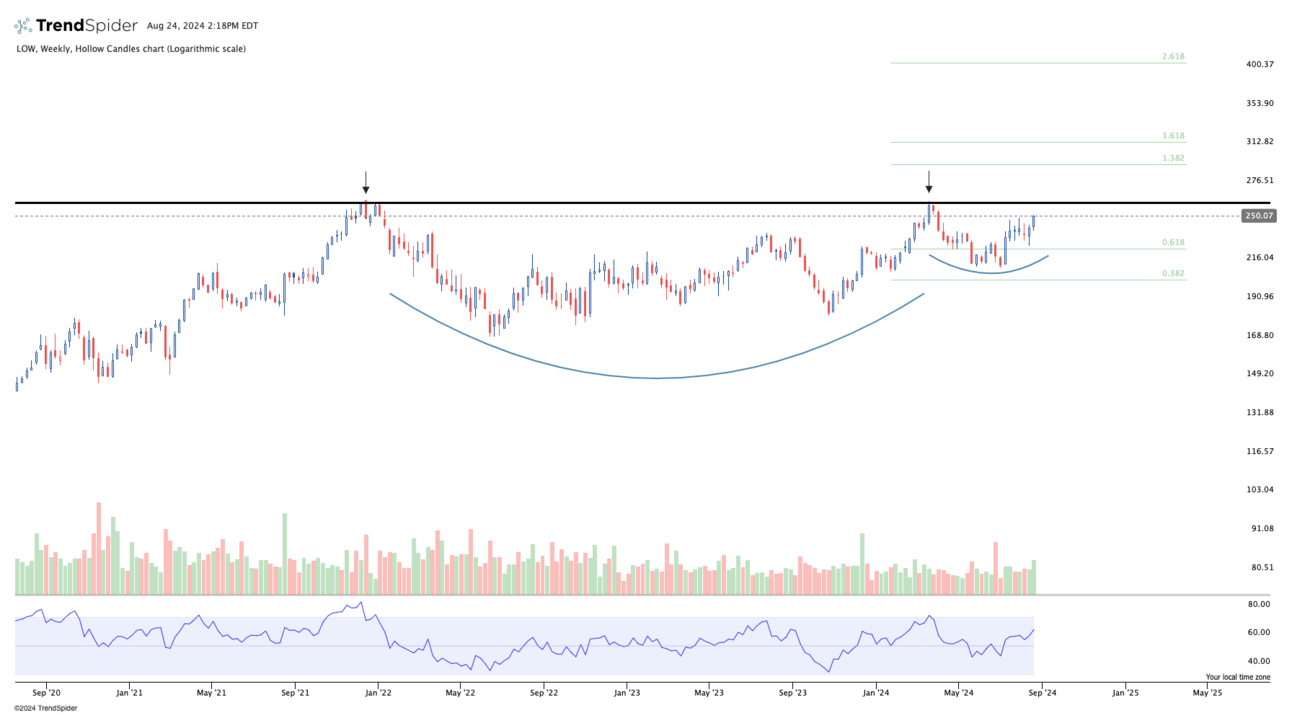
LOW: Lowes chart was shared last week. Finished the week up +3.70%. I’m looking for this to test the upper resistance at $261 and hopefully breakout of this multi-year cup and handle formation.
BBY: Best Buy has been consolidating sideways in this rectangle formation. Now its forming a multi-month flag right under the upper resistance zone around $87-$88. Looking for this to fully breakout over the line and trigger the next move higher out of this consolidation.

BJ: BJs Wholesale Club broke out of this 20 month base back in May. Now it’s retesting previous resistance which has turned support. This offers a low risk entry where risk can be managed much easier. If price closes below the support zone I’m no longer interested.

BRX: Brixmor Property Group broke out of a multi-year price base. RSI is definitely a bit high and could mean some consolidation is in order to support higher prices. Nonetheless, the chart is giving a confirmed breakout.

CMRE: Costamare Inc pulling back sharply after testing the upper resistance zone at $16.75. I’m watching this one to see if price can stabilize at this level after this pull-back and begin to curl higher. Risk can be managed quite easy using the recent lows as a potential stop area to manage risk.

CUBE: CubeSmart was shared in last weekends newsletter and is now up +5.82% on the week giving us a confirmed breakout over resistance signalling the next leg higher. Looks like a larger move could just be getting underway.

DOV: Dover Corporation forming a massive multi-year base with a tight consolidation for the past few months right under resistance. Price is testing that upper resistance line as we close the week. Watching for a breakout over the line.

ED: Consolidation Edison tightly consolidating right at the upper resistance line after a failed attempt to breakout a few weeks back. This may need more consolidation, but either way its hovering right at breakout levels. If it gets back over the black line I am interested.

ELV: Elevance Health has been on watch for a while. Price is forming a cup & handle pattern and its currently testing the upper resistance zone. Watching to see if price can push over this line and signal the next move higher.

FCX: Freeport-McMoRan is bouncing along this lower support zone. I’ll let this line act as a level to trade around. If price is to crack below that slanted support level all bets are off. But if price can maintain that level and continue to put in higher lows I am interested.

FR: First Industrial Realty is breaking out of multi-year consolidation. Price has been forming a bottom basing pattern since August 2022. I’ve overlaid some fibonacci levels as price targets to trade around.

IGV: iShares Tech-Software ETF was shared weeks ago as it was forming this consolidation we’ve seen over the past several months. Price managed to trade all the way up to its upper resistance zone but pulled back aggressively with the overall market. It’s made a pretty strong recover since then and looks like it could test resistance again. I’ll be looking for a breakout over that line to new highs.

J: Jacobs Solutions forming a cup and handle pattern. It previously attempted a breakout over resistance in March but wasn’t quite ready. Price pulled back and has been consolidating under resistance since then. Its now beginning to push back over resistance signalling a potential leg higher.

KBR: KBR Inc forming a tight cup and handle pattern. Price has been consolidating right at the upper resistance zone for several months. I’m looking for this to breakout over resistance and clear those previous highs to signal the next move higher.

META: Meta is back at resistance yet again. Consolidating sideways right at this resistance level. Price actually made a new all-time-high last week but couldn’t stick the landing. I’m watching this one for a proper breakout from this resistance level.

MORN: Morningstar putting in a multi-month consolidation within a much larger multi-year basing pattern as it tries to complete the right side of this base. It tried to breakout a few weeks back, but like many things pulled back with the market environment. Watching for a second attempt to push back up to previous highs.

MRO: Marathon Oil Corporation made it onto the list this week. A few energy names popped up in my scans but this one looked the best to me. Price is trading in this well defined triangle pattern. More notable is the past few months price action has been trading in a pretty tight range at the upper end of resistance. Watching for a breakout over the upper line to signal a change in direction.

ONON: On Holdings is stair stepping higher. After breaking out over the $36 level in May, then consolidating over resistance, and now pushing above the $43-$44 level, clearing the previous highs, it’s signalling the next leg higher.

OTIS: Otis is retesting support for the second time since breaking out of this multi-year base in February. This offers a good risk/reward play. If price can hold above support I am interested, but if it cracks below that level all bets are off.

SCI: Service Corp was shared last week and is now beginning to turn up. This is a second attempt at this breakout which occurred just a few weeks back. This chart is in play right where it sits.

SHW: Sherwin-Williams breaking out of a massive cup and handle formation. Price cleared the upper resistance level this week signalling a breakout higher. Chart is in play right where it sits.

SKY: Champion Homes chart looks great. Price is giving a clean breakout over a long standing resistance zone at around $86. The volume stepping in for this breakout is a very healthy characteristic. This chart is in play right where it sits.

SLV: Silver has been consolidating over the past few months. It broke out of this massive multi-year base, but then needed to consolidate before continuing higher. Price managed to reclaim resistance last week and is now back on my radar. I still want to see price find it’s footing, but its starting to look promising.

SPGI: S&P Global which was shared in previous weeks is breaking out of a massive cup and handle formation. I’ve overlaid some fibonacci levels to trade around. The chart is in play right where it sits.

SSB: SouthState monthly chart below looks amazing. Price tucked back under resistance after breaking out last month, but is now getting back over resistance this week. The monthly close on this candle will be telling. But nonetheless this chart looks like it could be at the beginning of a much larger move.

STE: STERIS plc is still tightly consolidating right at resistance. I’m watching for a breakout over the black line and for prices to push back up to former highs.

TMO: Thermo Fisher has been on watch for weeks. Price is still flirting with resistance as it tightly consolidates right on the line. I’m watching for an official breakout over this level to signal the next trending move higher.

TTD: Trade Desk casually marching higher as it pushes away from the resistance line. This has been a long standing resistance zone and price is overtaking it signalling a new trend higher.

TNX: Texas Instruments putting in a beautiful breakout over resistance last week. This chart has been shared in the previous weeks newsletter as I’ve been stalking it for some time. This breakout of this massive multi-year base signals a new move higher.

WHD: Cactus Inc continues to consolidate right above resistance after breaking out of this multi-year base. A push higher could come at any moment. The chart is in play right where it sits.

WSR: Whitestone REIT pulled back under resistance after breaking out to new all-time-highs. It’s consolidating right under resistance and could be setting up for a second breakout attempt.

Have a good trading week everyone! Hopefully there was some value found in this weeks watchlist and that it helps generate some trade ideas going into next week.
Together We Trade
Noah