- Together We Trade
- Posts
- Charts To Watch!
Charts To Watch!
Noah
June 26, 2024
Traders,
After scanning all the major indexes, I’ve put together a list of stock charts which I believe have strong set-ups going into next week.
Tickers: MATX, MCO, AMZN, IGV, CARR, CTAS, META
Let’s take a look at the individual charts:
MATX (weekly chart): This is a clean cup & handle pattern with a well defined resistance line. Price is currently breaking out over this resistance area and pushing to new all time highs. Price made a slight retest of the previous resistance line which held and is now acting as support. As long as price remains over the resistance line, the chart is set-up well going into next week.

MCO: Once again we see price breaking out of a cup & handle pattern to new all-time highs. There is a well defined resistance line which price tested on several occasions over the past couple of years and now price is pushing through that resistance area. As long as price remains above the line, the chart looks great.

AMZN: Amazon has been testing the $188-$189 level several times over the past couple of years. Price currently is consolidating right at this resistance level after a strong trending move which is something I like to see before breakouts. It looks as if price is simply digesting the recent price increase and is setting up for a breakout to new all-time highs. I am extremely interested in AMZN if price can break above the line and hold this level. .

IGV: This chart is in the developing phase. Entering here offers a pretty well defined risk level just under the lows around $76. I would like to see price curl up and retest that upper resistance line and potentially set up for a breakout to new highs. You could always keep this chart on your watchlist and wait for the breakout over the resistance line before taking a trade as an alternative option.

CARR: Nice cup & handle pattern on the weekly chart. Price has broken above resistance and is now consolidating. It looks as if it needs to digest the recent breakout before potentially pushing to higher.

CTAS: Nice base forming on the daily chart. Price tested the blue resistance line multiple times, and is now consolidating right on or slightly above the line. I’m looking for a clean close over the blue line to signal higher prices.

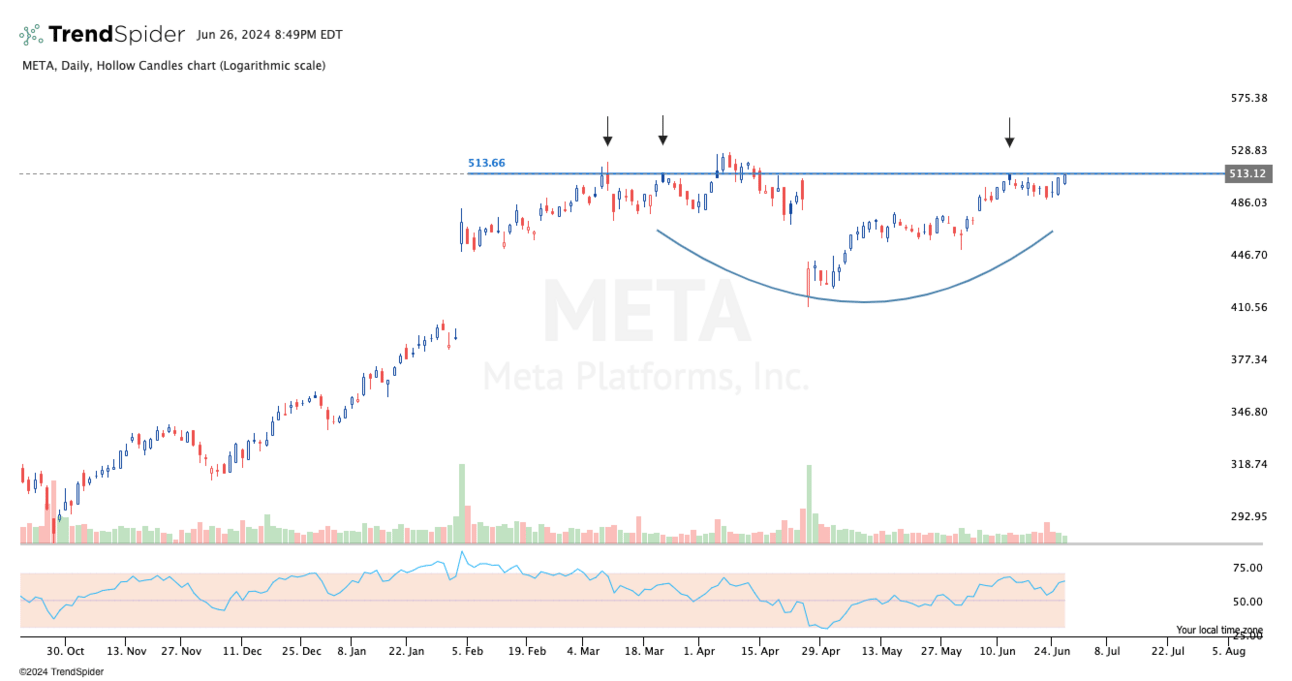
META: Price has tested the blue resistance line multiple times over the past few months. First attempt to breakout over this level failed, but price is now rising back up to that resistance line and looks like it may take a second attempt at a breakout higher.
Thanks for tuning in to this weeks charts. See you next week!
Noah