- Together We Trade
- Posts
- Charts To Watch!
Charts To Watch!
Noah
July 13, 2025
Hello Traders,
Markets are holding there ground steadily. Bitcoin is blasting higher and crypto’s are heating up. It feels like all systems go. Until we see things change I will continue to participate in breakouts. Things could change on a dime, we all know that. A pull-back or some sideways action, and some rotation is welcomed. Sustained upside is what I ultimately want. We’ve managed to put in a V-shaped recovery, blast through previous all-time-highs, and charter new ground. Even if the markets want to take a breather, I would be in the camp that dips would be buyable.
TICKERS
HSAI, SMR, HNRG, MSTR, IMO, WELL, THC, SOLUSD, TT, WAB, C, AL, SPGI, BSX, MMM, CNM, TOST, FOX
Let’s get into this weeks charts!
HSAI - Hesai Group: This is a high beta name, so it moves a bit more aggressively. We have a nice cup & handle formation developing and price is starting to push higher into last weeks close. I’ve highlighted a yellow tinted zone, which shows the previous all time high level, which is also the IPO day. We could look at this as an IPO base if we can breakout if we get the breakout through this level.

SMR - NuScale Power: This is another high beta name. We have a big base breakout that took place, and now price has been going through a consolidation/pull-back phase. We have the rising 50-day moving average catching up to price which is lining up with the blue line, which is the initial breakout level. I’m looking at this as a bit of retest play and I’m hoping both the previous resistance will act as support, and the rising 50-day will help lift price up going forward.

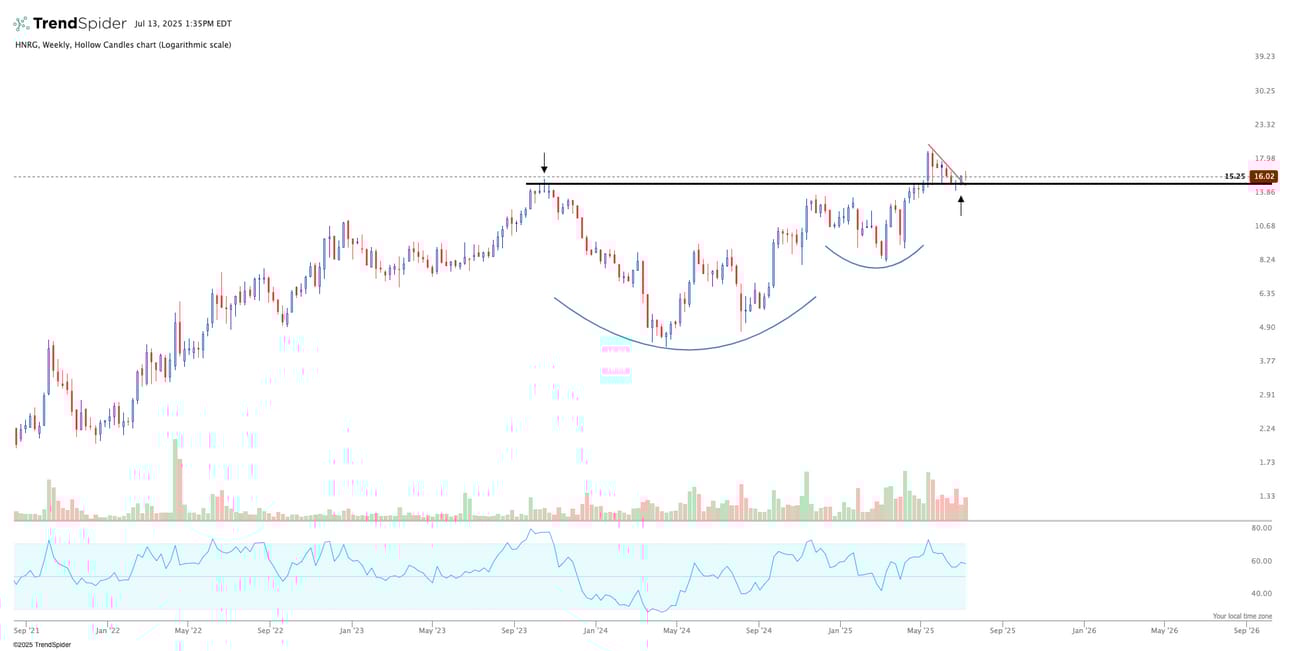
HNRG - Hallador Energy: This is a weekly chart. I shared this chart months ago prior to it ever making a new all-time-high breakout. Its now undergoing a consolidation/pull-back phase and is coming right back into that previous breakout level. I am anticipating this level hold and for that prior resistance to turn support. I want to see price firm up right here to get really interested. If we start to crack below that black line I will no longer be interested.
MSTR - MicroStrategy: Big cup & handle formation. Pretty straight forward approach, as long as price can hold above that black line and build higher from here I like it. If we start to fail, and fall back below the line, it will go back on the watchlist and wait for a new setup in the future.

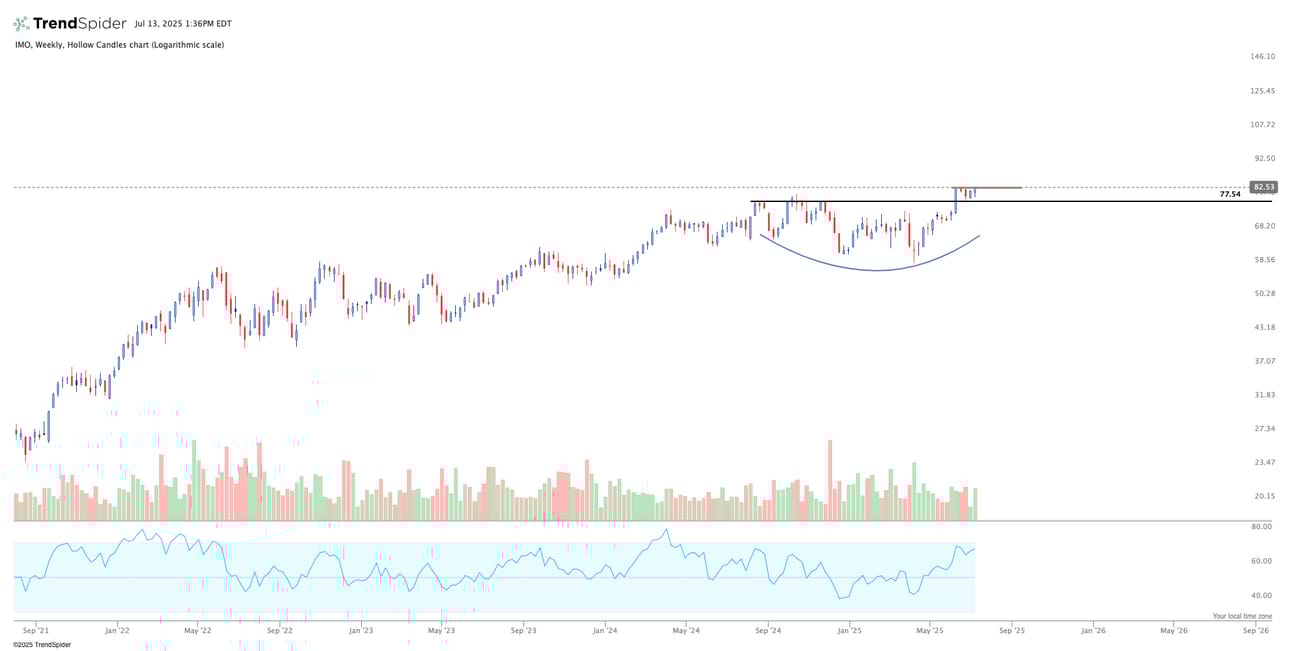
IMO - Imperial Oil: Weekly. chart here. This is a super clean setup. We have a nice big base, which there was a strong breakout from. And now followed by a tight consolidation above resistance. This looks like its setting up for a continuation higher.
WELL - Weltower Inc: We have a multi-month base/consolidation pattern forming. Price has been really tightening over the past couple of months, and finding support at the 50-day moving average which is ever so slightly sloping higher. We have a clear resistance line in blue, which price hasn’t managed to push above. I’m waiting for a breakout above the blue line, and ideally would like to see that 50-day slope higher and help lift price and continue to act as support.

THC - Tenet Healthcare: Massive base formation. We got a breakout over resistance a couple weeks ago, and have more or less consolidated sideways ever since. I want to see that blue line hold as support, and start to see this name grind higher and put in a continuation to the upside.

SOLUSD - Solana: I don’t share crypto charts a lot, but with the recent action in Bitcoin and Ethereum, it’s worth pointing out the Solana chart. This is beginning to look like a clean base formation in the early innings. After pushing through that slanted resistance line, we are once again forming a tight coil. I would like to see this retest that blue horizontal resistance line as a first target and setup for a new base breakout.

TT - Trane Technologies: Repeat name. Beautiful pattern here. Big base breakout, followed by a tight consolidation sideways for several weeks just above resistance. We now have the 50-day moving average catching up to price, and will likely to provide additional support and potentially help lift the price higher.

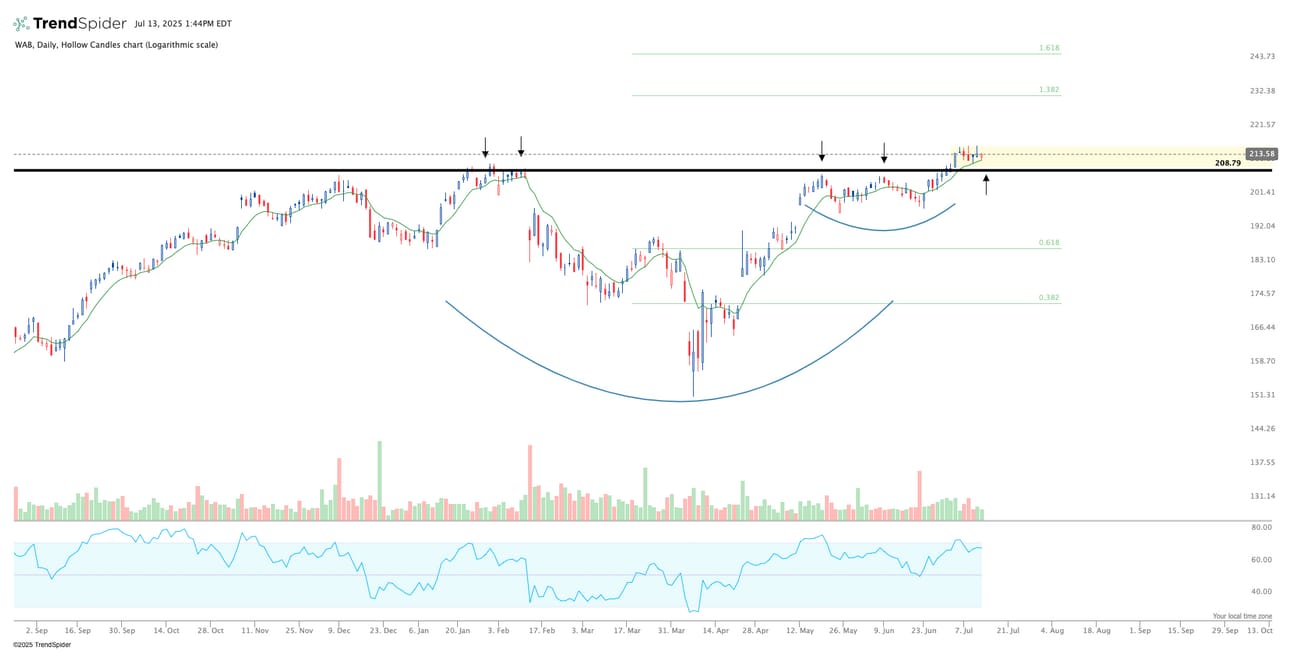
WAB - Westinghouse Air Brake: Once again, big base pattern. You notice how price formed a smaller base/consolidation under resistance prior to pushing into new all time highs. This really helps setup a sustained move. We got the breakout, and now we are coiling, and looking like a continuation to the upside is likely.
C - Citigroup: Massive base breakout followed by a mini consolidation which is letting price retest that blue line which is the breakout level. I want to see price respect that level and get a bounce. If we begin to crack below the line, all bets are off.

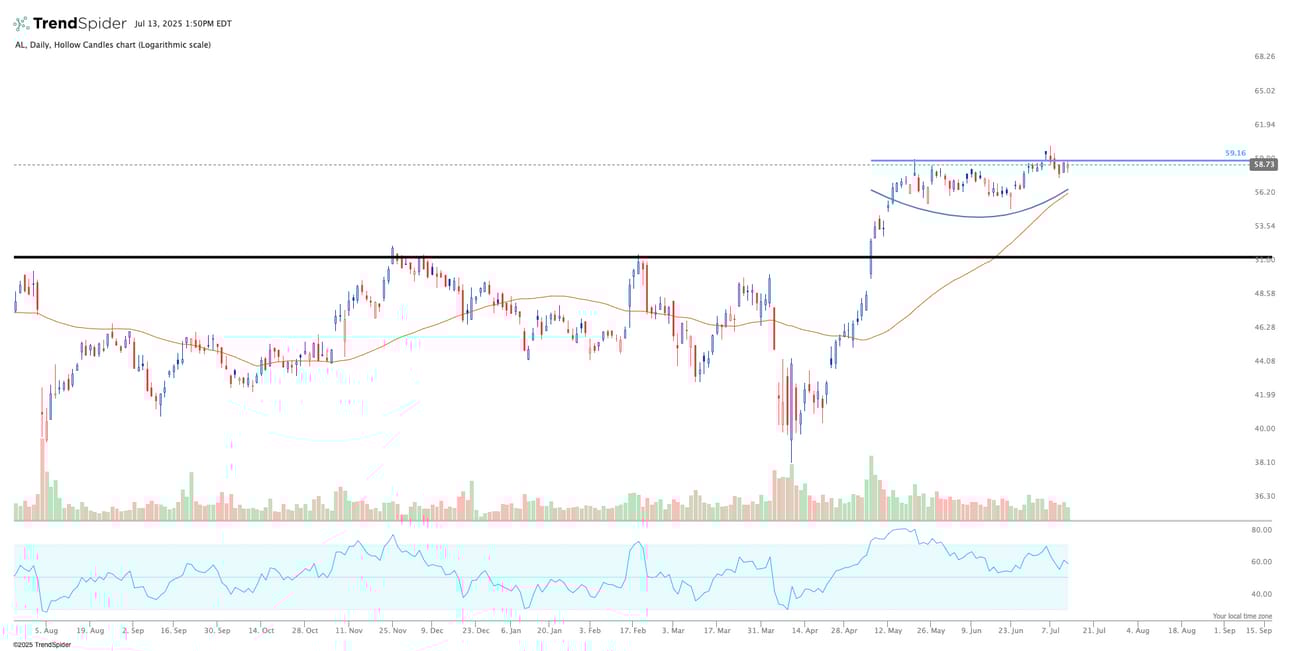
AL - Air Lease Corporation: Repeat name. The weekly chart of this paints a very clear picture, although I am using the daily chart here. You have an aggressive breakout from this horizontal resistance level (black line), which was then followed with this smaller consolidation pattern we find ourselves in. Simultaneously, the 50-day moving average is beginning to catch up to price, which I am hoping provides additional support to price, and assists with give the price a lift higher.
SPGI - S&P Global: Weekly chart. Price is sort sandwhiched in between the prior breakout level (lower black line) and the new resistance level (upper black line). But we have 4 very clean tests of that upper resistance line and price is looking like it wants to push through that level. Simultaneously, you have the 50-week moving average acting as some support and hopefully will help lift price higher.

BSX - Boston Scientific: I do really like this chart, although I want to see price properly reclaim the 50-day moving average. We sort of pushed below it last week which I didn’t want to see. Nonetheless, I am monitoring this chart closely as things can change fast. The chart still has a nice big base consolidation pattern, with a well defined resistance line above. I will wait for price to give us the confirmation we need and hopefully see it get back above the 50-day and show signs it wants to move higher. This could offer a low cheat entry prior to a breakout, with the ability to put a stop price just under last weeks swing low. Of course, we have to get confirmation first.

MMM - 3M Company: Inverse head & shoulders pattern developing here on the daily chart. We technically got a breakout last week, and now what looks to be a bit of retest of that breakout neckline. Simple approach here, as long as the line acts as support and holds, I like. If it fails and falls below, its back on the watchlist and waiting for a second opportunity.

CNM - Core & Main: Massive base on this weekly chart. It has already broken out of this base, and is now slightly tucking back in and looks like it may want to fully retest that breakout level. The goal here is to hold that lower blue line and firm up from there. If that level holds, this would offer a good risk to reward entry option.

TOST - Toast: Repeat name. TOST continues to consolidate. The 50-day moving average is right below price, which I anticipate to provide some support and hopefully help lift the price higher. We need to clear this range we’ve been trading in to really get going. But the setup overall looks great. Just have to be patient and wait for the confirmation we need to get involved.

FOX - Fox Corporation: I really like this chart. It had a really great move to the upside from March of 2024 to February of 2025. Now we find ourselves in this consolidation/basing phase. You could almost make this look a little like an inverse head & shoulders formation with a slanted neckline, but I’m not going to overcomplicate it. I’ve drawn a slanted resistance line which price is really trying to push through. We have the 50-day moving average right below price. Price pushed over the slanted line, tucked back in, and is retesting that slanted line, along with the 50-day moving average. If we can hold and start to firm up from here, this could provide a low entry with well defined risk level (below the 50 day).

Have a great week everyone!
Together We Trade