- Together We Trade
- Posts
- Charts To Watch!
Charts To Watch!
Noah
August 10, 2025
In partnership with
Learn from this investor’s $100m mistake

In 2010, a Grammy-winning artist passed on investing $200K in an emerging real estate disruptor. That stake could be worth $100+ million today.
One year later, another real estate disruptor, Zillow, went public. This time, everyday investors had regrets, missing pre-IPO gains.
Now, a new real estate innovator, Pacaso – founded by a former Zillow exec – is disrupting a $1.3T market. And unlike the others, you can invest in Pacaso as a private company.
Pacaso’s co-ownership model has generated $1B+ in luxury home sales and service fees, earned $110M+ in gross profits to date, and received backing from the same VCs behind Uber, Venmo, and eBay. They even reserved the Nasdaq ticker PCSO.
Paid advertisement for Pacaso’s Regulation A offering. Read the offering circular at invest.pacaso.com. Reserving a ticker symbol is not a guarantee that the company will go public. Listing on the NASDAQ is subject to approvals.
Hello Traders,
Markets have been showing strength yet again. The Nasdaq making a new all time high into Friday’s close. The S&P500 has fully recovered from that blip of a pull-back it experienced. Bitcoin is pressing back up agains $119,000. Something worth noting is the equally weighted Nasdaq & S&P500 ETFs (QQQE & RSP), have not shown the same strength over the past week. Both were relatively muted last week, sitting right on their 50-day moving averages, while the market cap weighted ETFs (SPY & QQQ) are pushing up into new high territory. Clearly the biggest and baddest names are leading the pack when we look at things from this lens. Earnings season has been pretty volatile, with either massive gaps higher on positive earnings, or big gaps down post earnings. Definitely has made it tricky taking new positions in stocks that have earnings right around the corner. I have missed a ton of trades due to waiting for earnings to be out of the way, many of which have blasted higher immediately. That is the name of the game. I will continue to monitor the equally weighted indexes in hopes to see strength show back up, as that would tell me theres broader participation under the hood. I will continue to participate going forward as I have been, but remaining moderately cautious. I’m still long term bullish, and dips to me seem buyable. But would like a little more consolidation to support more sustained upside.
TICKERS
AS, BABA, CEG, TGT, KWEB, NLOP, GLD, EXTR, EQT, PH, AXP, FHN, CTAS, TSLA, NVMI, VCTR, GLXY, TDS
Let’s get into this weeks charts!
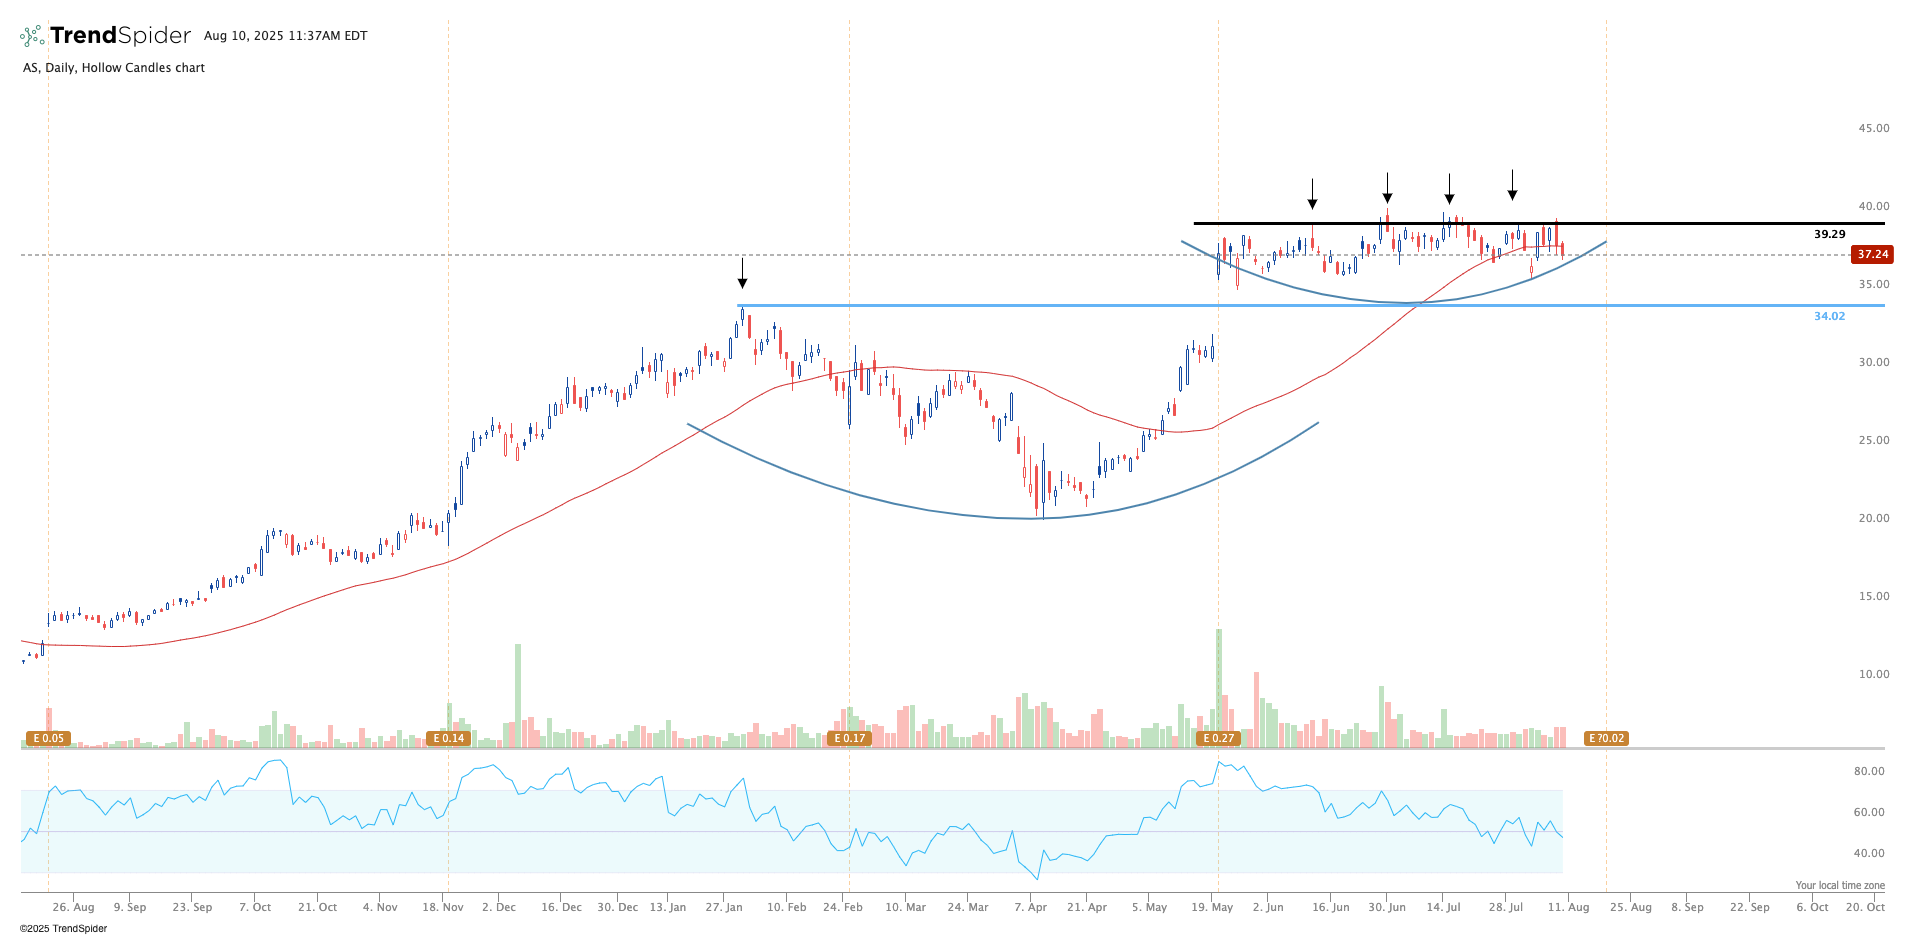
AS - Amer Sports (Daily Chart): Great overall look to this chart. It formed a big base, which was followed by a breakout, then its formed another base consolidation for the past few months. Giving time for price to digest the recent gains, and the let the 50-day MA catch up. It has been struggling to hold the 50-day more recently, which is making me slightly cautious. But, if this can firm up and hold above the rising 50-day, I will be very interested. Earnings are on August 19th. Keep that in mind.
BABA - Alibaba (Weekly Chart): I’ve shared this chart many times. Still waiting on the breakout. We have a massive bottoming base formation. A well defined resistance line, which price has failed to break above and hold. Simultaneously, there is a triangle formation building around the resistance line after the most recent breakout attempt. High on my watch for a move higher.

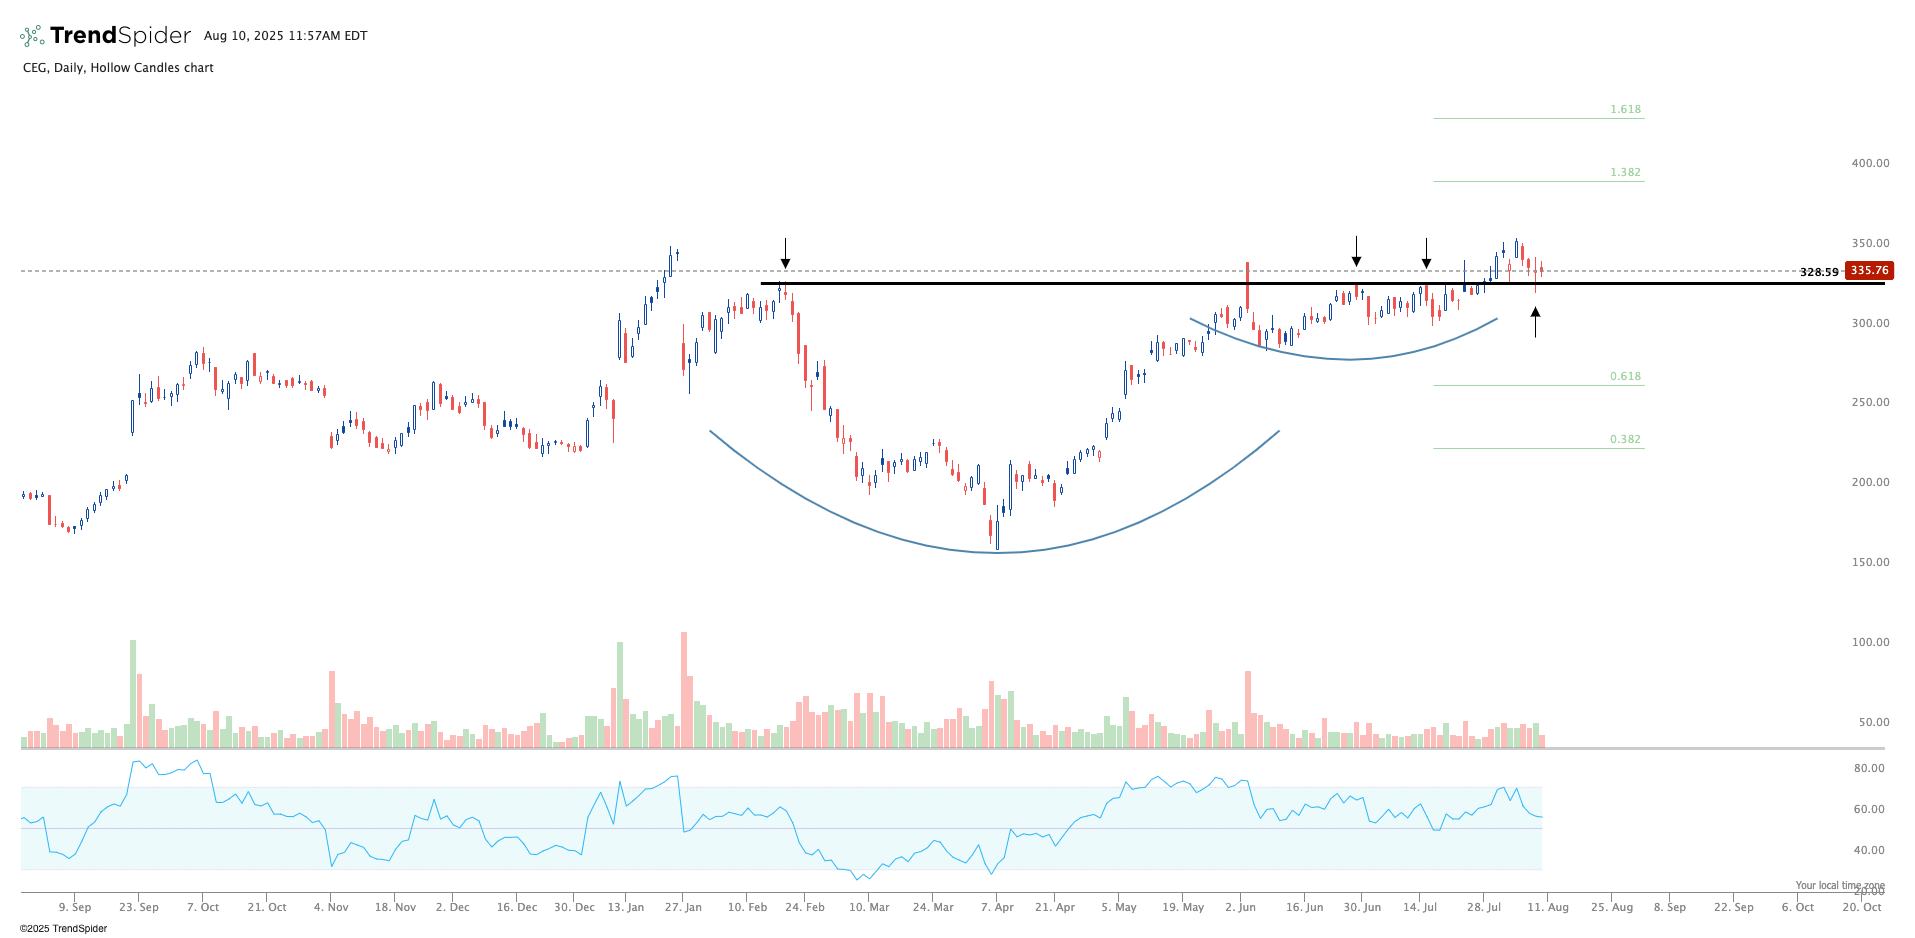
CEG - Constellation Energy (Daily Chart): This broke out of this cup & handle formation a couple weeks back. It just announced earnings, and price has pulled back into the breakout level. Its holding this level for now. As long as it can remain above this line, and build higher, I like it. If we start to break below the line, all bets are off.
TGT - Target (Daily Chart): This name has been beat down for years. The pattern could technically look like a bear flag, however, given the extent of this down move, I am anticipating this to begin firming up at this level. I could be wrong, but that is why I am waiting for price to confirm first. I want to see it clear that black resistance line to signal a character change. So this one is on watch for now, but these plays that have been down so aggressively can move swiftly when they do go.

KWEB - China Internet ETF (Weekly Chart): I continue to stalk this chart. Big bottoming base for China. Price has been finding support on the rising 50-week MA on pullbacks, and this rising 50-week MA is now starting to catch up to price, as it continues to tighten. I feel like this is beginning to really setup for a potential push higher given how well price is acting right above that key resistance line.

NLOP - Net Lease Office Properties (Weekly Chart): Nice weekly base forming on this chart. Price is tightening right above that resistance line, I would like to see this slowly start to push up into the right. Pretty clean chart overall. If we start crumbling below that line, all bets are off.

GLD - Gold Trust (Daily Chart): Gold had a decent week. Reclaiming the 50-day moving average, and back within the meat of this consolidation. The futures contracts pushed into new all time highs last week, all be it they faded slightly. But I like this over the 50-day, and will be a lot more aggressive if we push over that resistance line to signal the next leg higher.

EXTR - Extreme Networks (Weekly Chart): Nice bottoming base formation here. We got the breakout over resistance last week. Game plan here is quite simple, as long as we hold above the black line I like it. If we start to lose that level, and break below it, then things change.

EQT - EQT Corporation (Weekly Chart): Pretty sure I’ve shared this one over the past newsletters I’ve put out. We have fully retested the initial breakout level, which presently is acting as support. As long as price holds above this level, and can start to build from here, I like it. If we lose this level, and break below it, all bets are off.

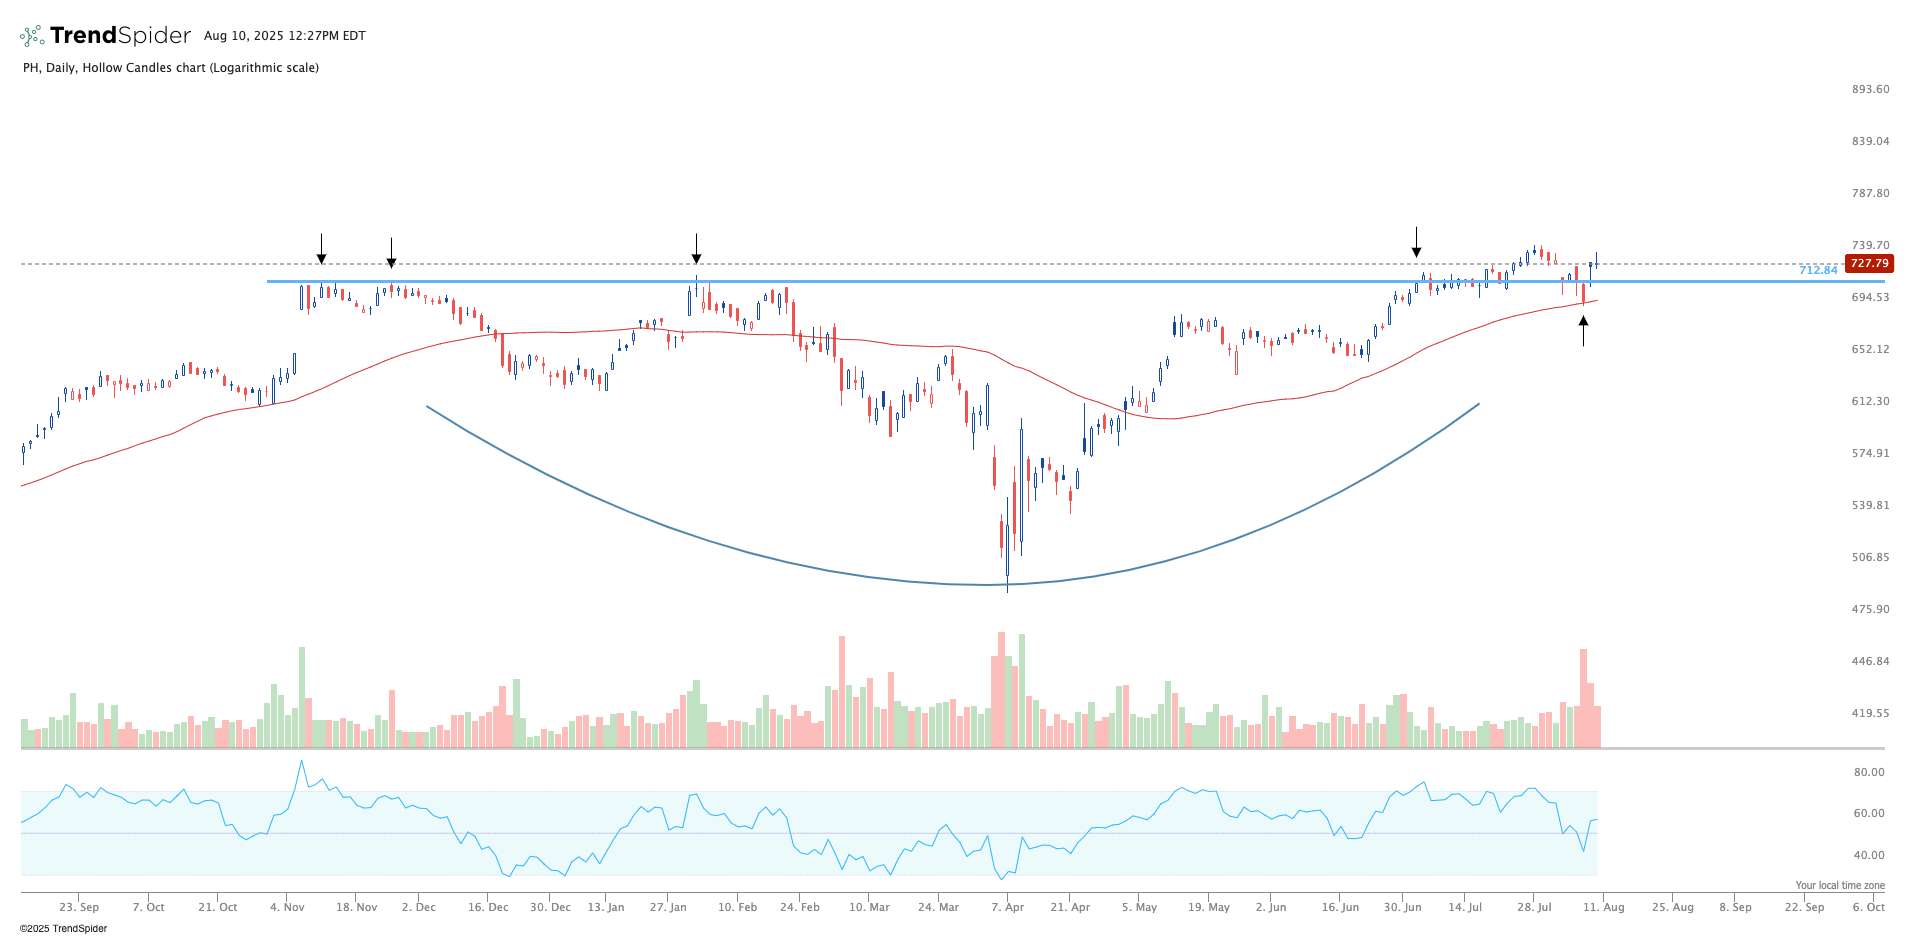
PH - Parker-Hannifin (Daily Chart): Big base formation. We got a breakout several weeks ago, but it wasn’t quite ready. It preceded to pull-back into the 50-day moving average, but then quickly reclaimed the resistance line post earnings. You could have a stop below the blue line, or just under the 50-day MA, depending on your risk parameters and timeline. I want to see this one start to build higher from here.
AXP - American Express (Daily Chart): I could be dead wrong about this chart setup. But It looks like we could be forming the handle consolidation on this cup & handle formation. Obviously we are trading below the 50-day which is not good, however, if this can reclaim that level, I would get very interested. Price needs to confirm itself first, so this name will be on watch until then.

FHN - First Horizon (Daily Chart): Similar setup as AXP, except this one is trading above the 50-day MA for now. I want to let price prove itself first, and really begin to firm up here. But it made an attempt at breaking out of that base formation prior to this pull-back, but clearly wasn’t ready. Now we seem to forming a the handle consolidation on what could be a big cup & handle formation. This current pull-back looks like a very normal pull-back within a rising trend. If we start to crack below the 50-day, I would be more cautious.

CTAS - Cintas Corporation (Daily Chart): Another big cup & handle formation building here. If you look at this chart and compare it to AXP, you will see how this was trading below the 50-day MA several weeks back. Even then, you could anticipate this being a normal pull-back/consolidation after testing prior highs. This one quickly reclaimed the 50-day and is now pressing back up to former highs, and looks to be setting up for a potential breakout. I will look at the 50-day for support on any pull-backs.

TSLA - Tesla (Daily Chart): All eyes on this chart as of late. Price is really tightening at the moment. Last week we pushed back above the 200-day & the 50-day. A move one way or the other feels close. If we can get a strong close above that slanted resistance zone, I think this one could get going. But if we fail to hold the moving averages, this could start to break down. Waiting for price to confirm it’s next move.

NVMI - Nova Ltd. (Daily Chart): Another cup & handle formation building here. We are in the handle consolidation phase. Price has pulled back into the rising 50-day moving average on this pull back. If we can show strength at this level, I would get very interested. The volume pattern isn’t the prettiest, but that comes secondary to price. Will be looking for a bit of price strength to get involved.

VCTR - Victory Capital (Daily Chart): Nice big base pattern developing. There is a well defined resistance zone above, and the rising 50-day moving average acting as supports on pull backs within the right side of this base. Definitely looks like its firming up as price flirts with that resistance line. Looking for a breakout above the line to signal the next leg higher.

GLXY - Galaxy Digital (Daily Chart): Really clean chart on this one. We have a mini-base, followed by a breakout, and then a retest of the breakout level. I’m looking for a little push to get us pasted this consolidation/pull-back we find ourselves in, and I think that would really give this some juice to continue higher. I will wait for that price confirmation first.

TDS - Telephone & Data Systems (Daily Chart): Nice base formation developing yet again. We have a well defined resistance zone, which price made an attempt to breakout of once already. Clearly it wasn’t ready at that time, and has pulled back under the line, into the rising 50-day moving average where it found support. Its now starting to push back up to those highs. On watch for a breakout over the line if the market gives it to us.

Thanks for tuning in as always!
Have a good week.
Together We Trade