- Together We Trade
- Posts
- Charts To Watch!
Charts To Watch!
Noah
July 20, 2025
Hello Traders,
The S&P500 and Nasdaq continue to grind higher. Managing to post new all time highs yet again last week. I definitely think some level of consolidation is needed, but I won’t fight the trend. I think it’s wise to tighten stops where it makes sense, and take only the best looking setups as we continue to push higher without any real consolidation. I am in the camp that any pull-backs in this market are buyable, so if we do get one, I will be looking at it as an opportunity add long exposure.
Tickers
RDDT, ALAB, FOX, WAB, GILD, META, HSAI, AAPL, SYK, CNP, BOOT, FTS, PH, KWEB
Let’s get into this weeks charts!
RDDT - Reddit (Daily chart): I shared this chart as it began it's breakout from this bottoming base. Its acting very constructively all in all. It pushed to the upside, and now is consolidating/pulling back. The 200 day MA and 50 day MA are beginning to catch up to price. I would like to see these MA’s provide some additional support and help lift this back to the upside for a continuation.

ALAB - Astera Labs (Daily chart): This has definitely been a tough stock to own, as this consolidation has looked like it was on the verge of breaking out several times, only to then drop right down to the low end of the range. Regardless, it’s managed to hold above the 200-day & 50-day MA’s throughout this consolidation and just broke above resistance to close the week and held that level. I will be looking for a continuation to the upside from here.

FOX - Fox Corporation (Daily chart): I shared this chart last week I believe. It looks like it’s trying to complete the right side of a big basing pattern. I’ve noted the slanted resistance line which price broke above and is now retesting, which also lines up with the rising 50 day MA. I would like to see price firm up at this level, and begin to show strength. If we begin to break below the 50-day and the slanted resistance line all bets are off.

WAB - Westinghouse Air Brake Technologies (Daily chart): We have a clean breakout above resistance from a big base. Price is now trading sideways just above that breakout level which is holding as support. Looks like it could be setting up for the next push to the upside.

GILD - Gilead Sciences (Daily chart): This one is right at the do or die point. Its pressed right up against the 50-day MA. If we begin to break below the 50-day I wouldn’t touch this. If we can firm up at this level, then we have a really good risk to reward setup. Biotechs in general have been showing positive technical signs, so we could have some industry momentum behind this name. Still need some price confirmation before taking a position.

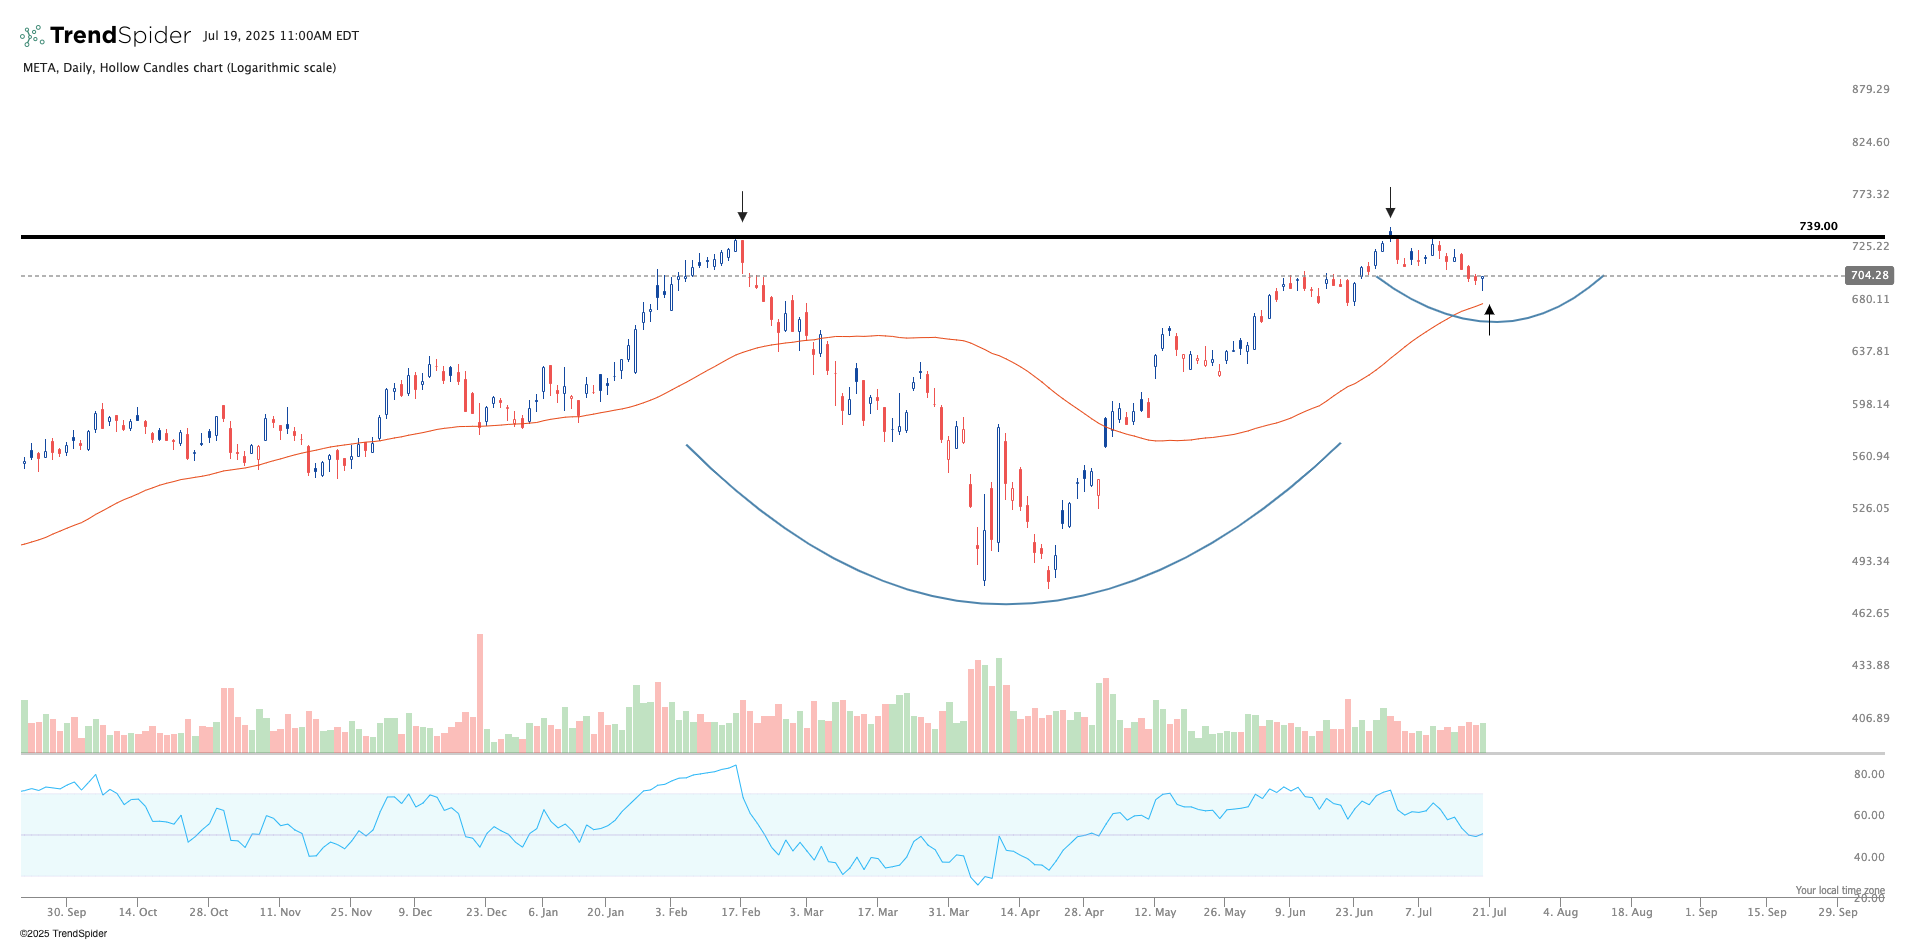
META - Meta Platforms (Daily chart): We have a nice big base formation, and now we look to be forming a smaller base or handle consolidation after rejecting that upper resistance line. It’s too early to take an entry in my opinion. I would like to see some price confirmation that this doesn’t want to test lower. The rising 50-day moving average is not far off, so ideally I would like to see this provide some additional support as we form this handle consolidation. On watch for now, but high on my list of interest.
HSAI - Hesai Group (Daily chart): This one looked like it was about to breakout last week, but wasn’t quite ready. We tested those former highs, and quickly retraced back to the 50 day moving average. I want to see this level act as support and begin to see price start to build back up from here. Ultimately I’m aiming for a breakout through that yellow tinted zone, as that highlights the all-time-high zone from this companies IPO. You have to be careful with this name, as it can move very aggressively.

AAPL - Apple Inc (Daily chart): Apple looks like its in the process of bottoming out and has formed a mini cup & handle formation just under a horizontal resistance zone. Pretty straight forward setup, as I’m looking for a breakout above the blue line to signal the next leg higher.

SYK - Stryker Corporation (Daily chart): Nice big multi-month base formation. We have several tests of that horizontal resistance line. It’s now forming a mini consolidation right under resistance, with the rising 50-day MA coming right up to the current price. I would like to see this guide price higher, and assist this name in a new breakout above this horizontal resistance line.

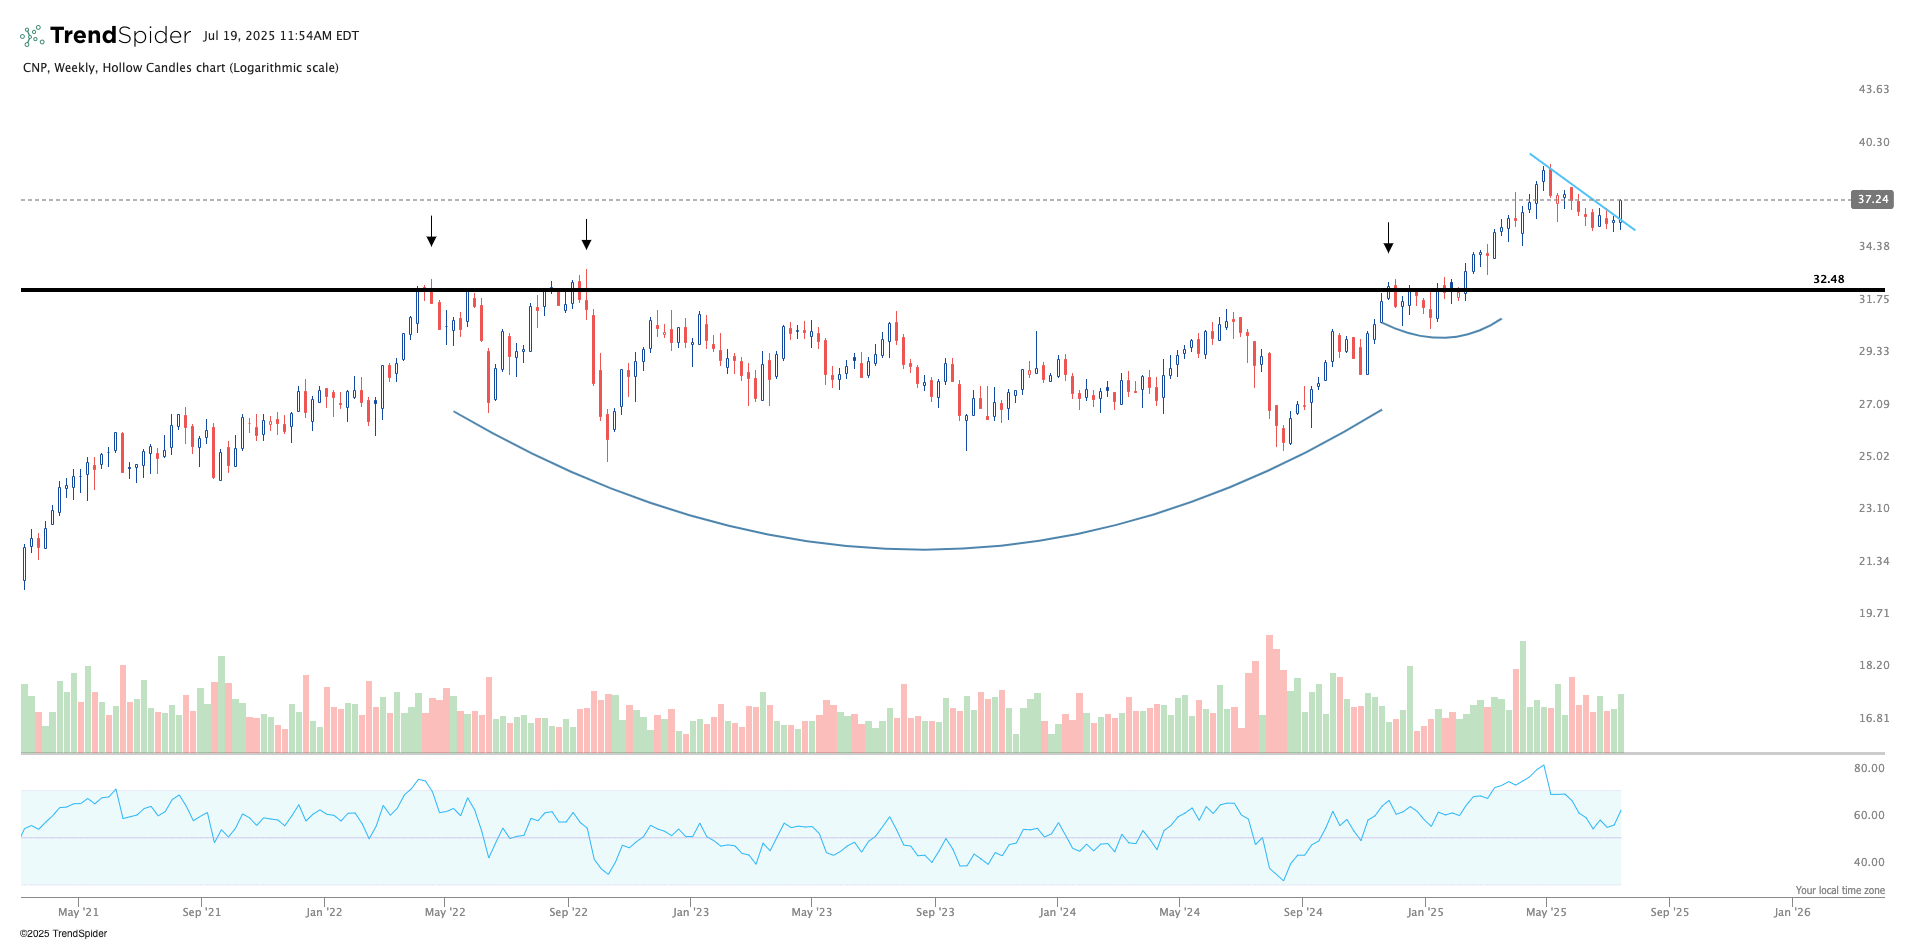
CNP - CenterPoint Energy (Weekly chart): This is a name that was shared months back prior to this breaking out of this massive basing pattern. The setup now looks to be a continuation to the upside. After the rally from this base, price consolidated/pulled back in a very orderly fashion for several months. We got our first signs of a change in character last week with a nice push above the slanted resistance line which has been guiding this recent pullback lower. This could be a bit choppy, but I would be looking for this to start building another mini base and hopefully setup a new all-time-high breakout.
BOOT - Boot Barn Holdings (Weekly chart): This chart shows a well defined horizontal resistance zone, which price has tested several times over recent months. For the past several weeks, price has really began to tighten just under that resistance line. I’m watching for a breakout over resistance to signal the next leg higher. This tightening price action right under resistance is leading me to believe that move may not be far off.

FTS - Fortis Inc (Weekly chart): This chart is still in the process of building back up to previous all time highs. It broke out of this bottoming cup and handle formation, it had a decent rally, and now is pulling back/consolidating in very clean and orderly fashion. It’s coming back in line with the breakout level as well. I’m looking for the next push to the upside from here. Based on how clean this consolidation has been, I think we will see that move soon and I would be aiming for a first target of the previous highs around $51.64 to start.

PH - Parker-Hannifin (Daily chart): Pretty straight forward setup. Big base formation, with a breakout of a horizontal resistance line which had been tested several times over the previous months. Price tightly consolidated right at that resistance line for a couple weeks prior to this push above the line which is a positive sign. I want to see price hold above this resistance line going forward.

KWEB - China Internet ETF (Weekly chart): China names have really been heating up. We officially posted a weekly breakout above resistance last week. This could be the beginning of a much larger move. It will come with its challenges and pull-backs as all trends do. But it has a lot of potential upside. I would like to see price hold above this line going forward. We’ve had several false starts, so I don’t want to see that happen again.

Thanks for tuning as always!
Together We Trade