- Together We Trade
- Posts
- Charts To Watch!
Charts To Watch!
Noah
October 19, 2025
In partnership with
Crypto’s Most Influential Event

This May 5-7 in 2026, Consensus will bring the largest crypto conference in the Americas to Miami’s electric epicenter of finance, technology, and culture.
Celebrated as ‘The Super Bowl of Blockchain’, Consensus Miami will gather 20,000 industry leaders, investors, and executives from across finance, Web3, and AI for three days of market-moving intel, meaningful connections, and accelerated business growth.
Ready to invest in what’s next? Consensus is your best bet to unlock the future, get deals done, and party with purpose. You can’t afford to miss it.
Hello Traders,
I didn’t put out a watchlist last week, as the markets really broke down last Friday, and frankly, most of the charts in my watchlist looked pretty ugly. I felt we needed to see where the dust settled. I use my watchlist as a gauge of market health more than anything, and my watchlists had few, if any, buyable setups for my approach. Obviously certain names still performed well, but many of these names were on previous newsletters, or were well within there advances higher and not really in positions I would be buying. It was certainly a choppier week. As of today, many names have been removed from my watchlists and some newer themes are beginning to show up.
The indexes managed to recover a decent amount of the prior weeks break down. All-in-all the indexes don’t look too bad. But with all the tariff talks and China trade war discussions going on, we find ourselves yet again, in a very news driven market. This can make trading a bit more challenging, especially if trying to take new positions. I personally didn’t really trade last week as I want to let volatility settle down, and see where things land. There is a clear theme in Healthcare/Biotechs/Pharmaceuticals showing up, so many charts below fall into this area of the market.
INDEXES
SPY | +1.74% |
QQQ | +2.45% |
IWM | +2.36% |
DIA | +1.55% |
TICKERS
REGN, NEOG, OPEN, OMDA, GEV, ARVN, IRM, PCVX, DAWN, TSLA
Let’s get into this weeks charts!
REGN - Regeneron Pharmaceuticals: This name has been beaten down for some time. We now look to be showing some early signs of a bottom here. We have a pretty well defined horizontal resistance zone at around $608, which price has rejected several times. I’ve also anchored the AVWAP off the 52-week lows, which you’ll notice price has been respecting this level on pull backs. We saw, a quick undercut of that AVWAP level last week, but price quickly recovered. This undercut provides a pretty clean risk level to trade against. There is a good chance I will be taking a position in this name next week, and I will use that $541 level as rough risk level to trade around. These bottoming plays in areas of the market which are gaining traction, which healthcare and pharmaceuticals are, can have pretty strong counter trend moves.

NEOG - Neogen Corporation: Another bottoming pattern on a beaten down healthcare name. Again, I’ve anchored the AVWAP off the lows this year, which price is now trading above, and has founds support at several times on pull-backs. You’ll also notice we trading right above the 50-day MA which is now beginning to slope upward. This is another positive sign. This did breakout 2 weeks ago, and it was an aggressive move higher, but its quickly faded right back into the 21 EMA and 50-day MA. This was a false breakout, and I’m hoping this name will take another attempt at this in the coming days/weeks. I would be using the AVWAP as the major risk level to trade agains which sits around $5.42. Alternatively you could use the 50-day for a more conservative stop. But its noteworthy how quickly this moved up to $7.16 in a single day. These names can move fast when they are ready.

OPEN - Opendoor Technologies: This name has been a bit of a stock market darling as of late. We are either going to fail here, or we are sitting near the lows of this consolidation. The 50-day is right below price, so maybe a full test of that level is needed first. But I will want to see price hold above the rising 50-day moving forward. This stock has moved a huge distance in a short time, so I always tend to be more cautious with these names, as these trades can often be a bit crowded. I will wait to see if price firms up early next week, and proves this pull-back has run its course. Another way to trade this, is to wait for it to breakout through the upper range (slanted blue line) of this descending triangle formation, as that would be the confirmation of the pattern. Below the 50-day would be my stop level on this trade if I was looking to enter it within this pull back.

OMDA - Omada Health: This is a pretty young name, only having been trading since June. It’s clearly trending higher since the initial breakdown following its IPO, and has formed a mini base consolidation over the past several weeks. It’s respecting the 21 EMA on pull backs recently. I would want to hold this as long as it remains above the 21 EMA. All in all, this is a pretty nice IPO base, which is showing signs a breakout may be coming which would take this into new high ground with very little overhead supply.

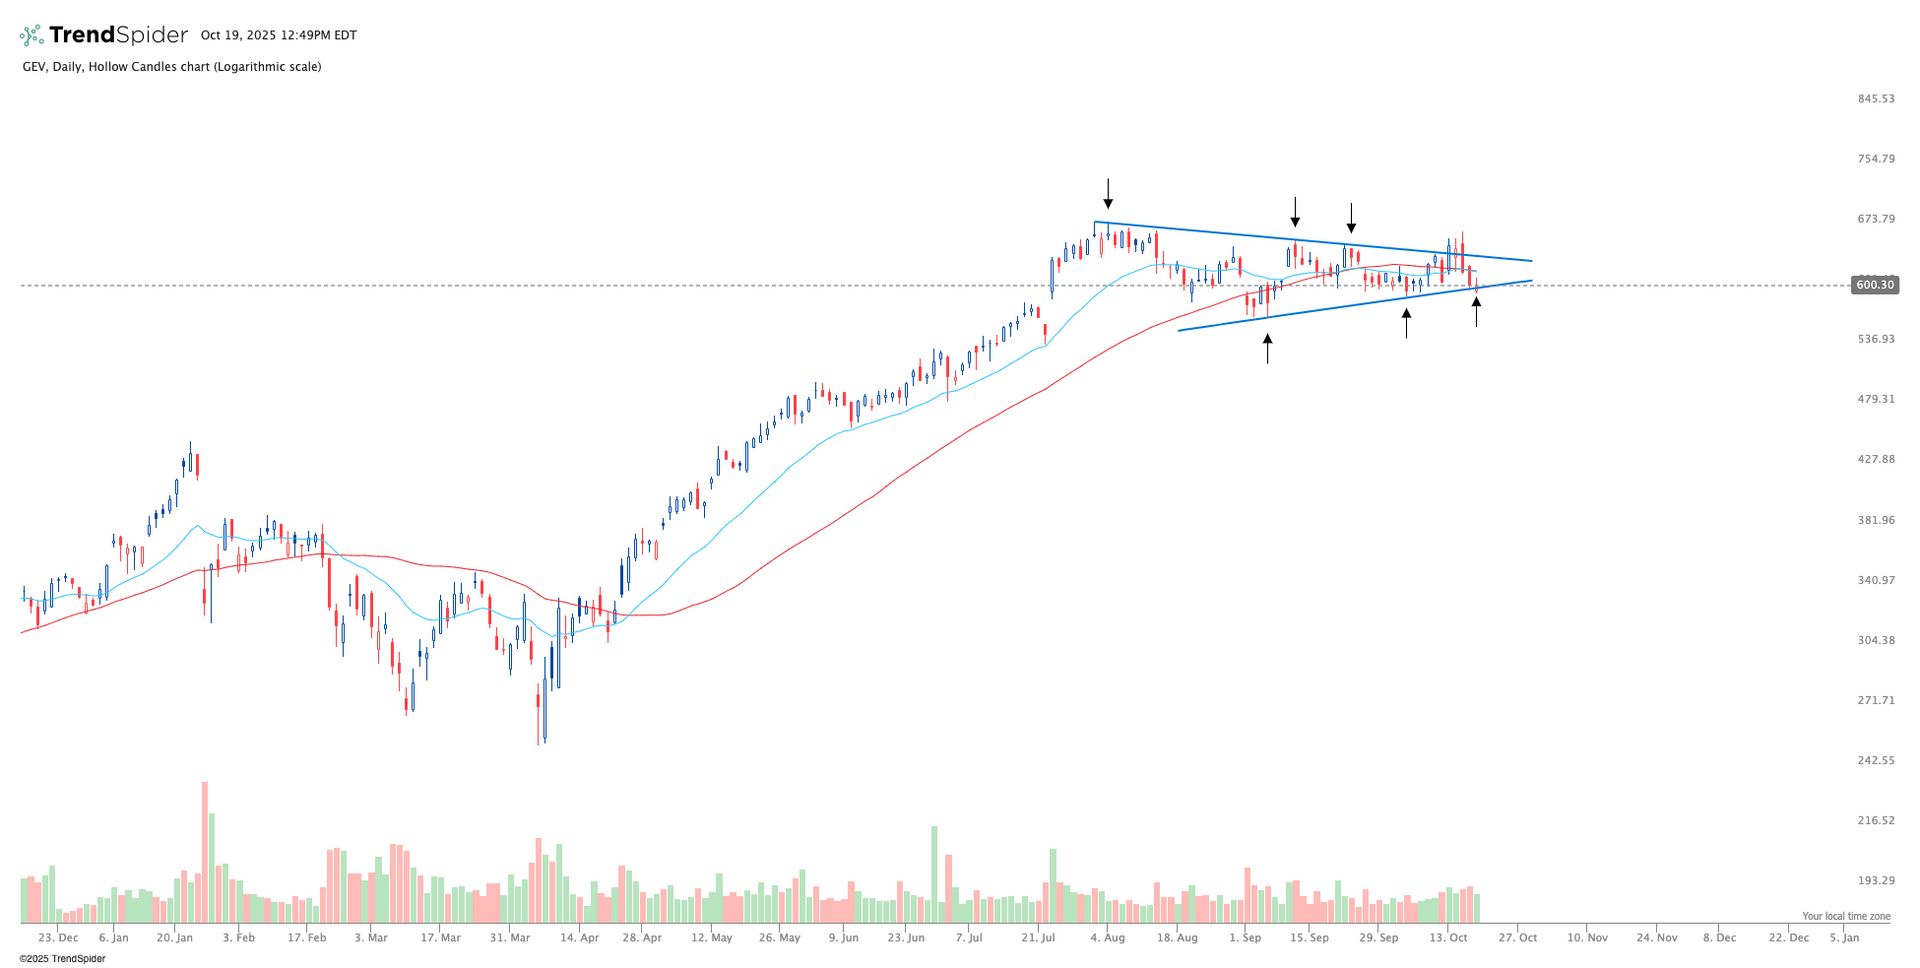
GEV - GE Vernova Inc: Symmetrical triangle formation in the works here. Price tried to breakout last week, but failed. I am a bit cautious with this name, as it’s sitting just barely above that lower support line and below the 50-day MA. I would have liked to see it hold above the 50-day last week, when the breakout failed. But I will monitor it into next week. If price can firm up and prove itself, then this could be nothing more then a bit of chop before a breakout. If we start really breaking below that lower support line, I will move on.
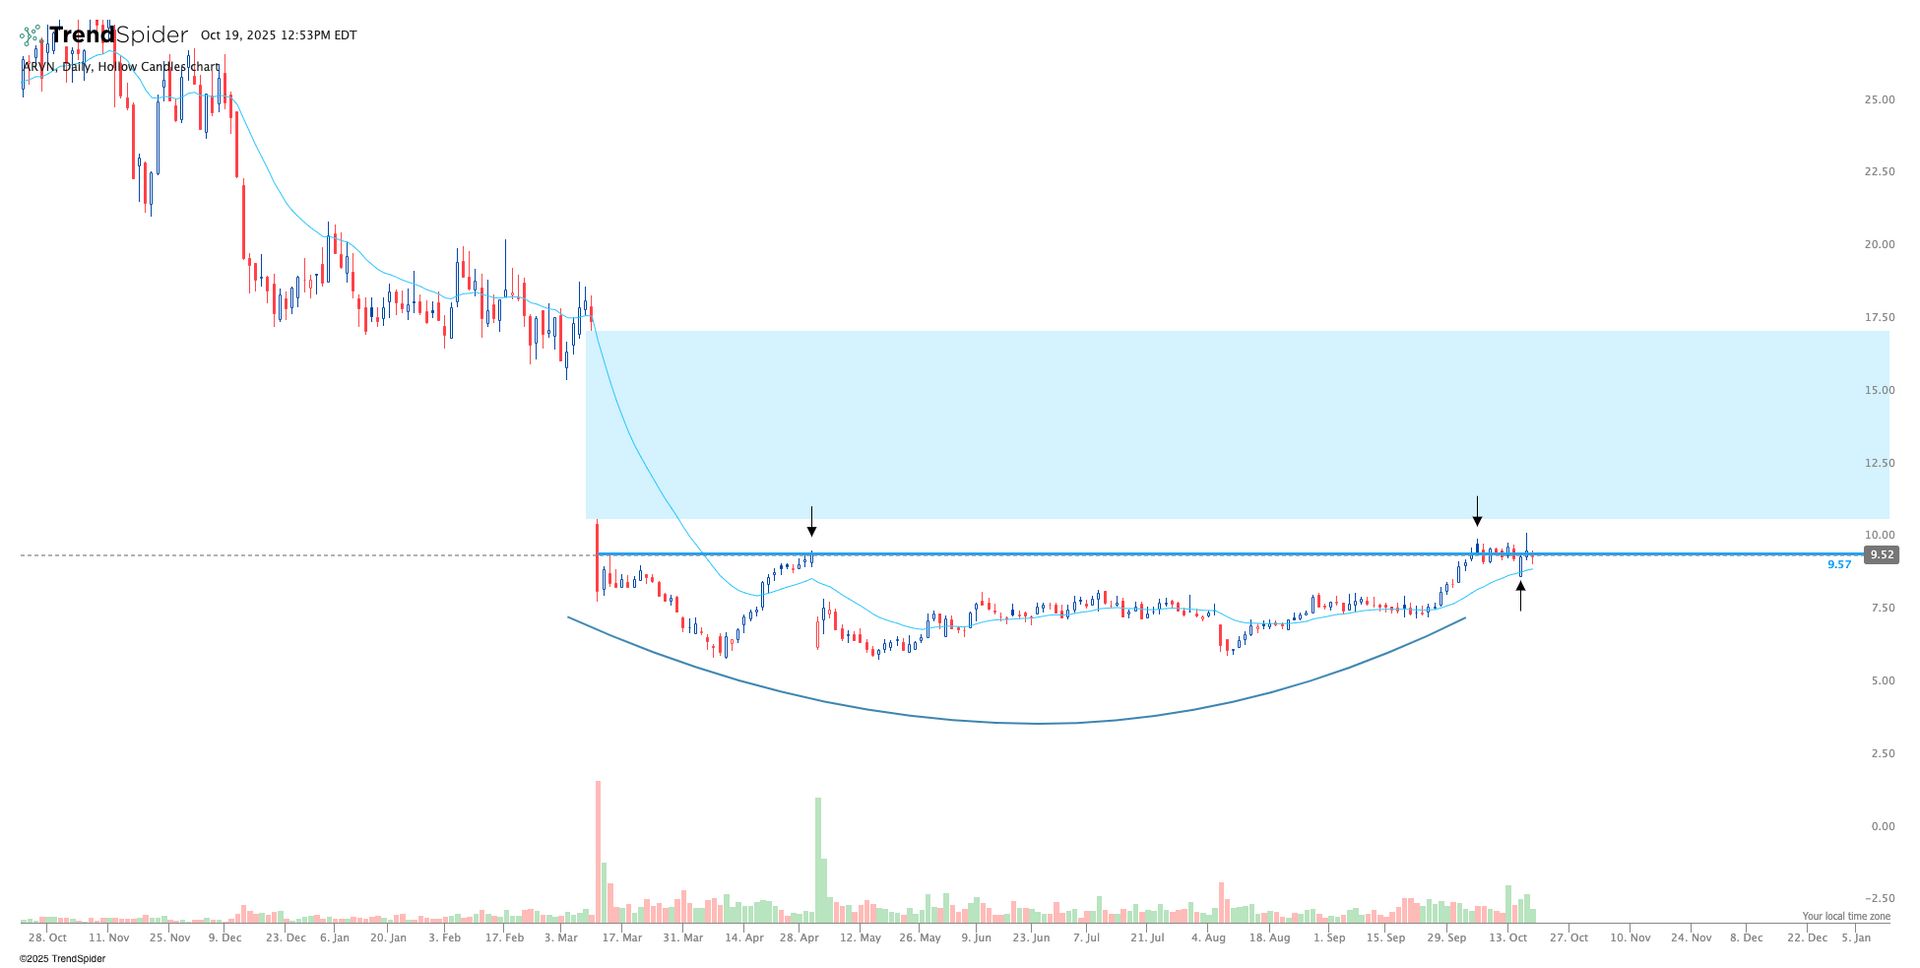
ARVN - Arvinas Inc: Another bottoming base formation on a beaten down healthcare/biotech name. Price is now consolidating right under that horizontal resistance zone. It’s respecting the 21 EMA on the most recent pull-back which is a positive sign. There is also a massive gap above, which if we can break into that gap, this could potentially setup a big move. Again, these beaten down names can have strong counter trend moves when caught early. I would like price to hold above that 21 EMA, however, these bottoming plays can be a little choppy when trying to move out of these bottoms, so it is possible to get stopped out early, but it would be wise to keep the chart on your radar, as a second opportunity could present itself quickly.
IRM - Iron Mountain Inc: This is a real estate name, which also happens to be a bit of an unloved space. I like to think, this sector could potentially be at a turning point. I’ve had several names in the space show up recently, however, this one looked the best for my approach. We have a well defined horizontal resistance zone we want price to break out of. Its currently attempting to do this, but its struggling a bit. But notice the 21 EMA is acting as a support level on these pull backs right around this resistance zone. I want the 21 EMA to hold going forward and will use that level to trade around. This one is on watch for a breakout over that horizontal resistance zone. This would signal the next leg higher.

PCVX - Vaxcyte Inc: Another healthcare/biotech name. Clean bottoming formation in the works. Price has technically already broke out of the bottoming pattern, and is now trading within this large gap. Its currently consolidating a bit after a sharp rally, which is totally normal. I would like to see the 21 EMA catch up to price, and ideally hold as support. For me, I have to wait and see that occur before entering this one. So, this name is on watch for now. If we get that 21 EMA test and bounce, I will have a lot higher conviction that this will continue to trend higher.

DAWN - Day One Biopharmaceuticals: Cleary a healthcare theme within this weeks watchlist as we have another healthcare/biotech chart here. Again, another beat down name, forming a pretty clear bottom. We have a horizontal resistance zone, which price has rejected several times. We also have a 50-day MA which is beginning to slope upward, and is acting as support on the most recent pull-backs. This could be bought right here at this level, which a stop below the 50-day MA. This would keep risk super tight, with a lot of potential upside. Alternatively, you could wait for the breakout above resistance. Either way, there looks to be some good potential upside if this theme keeps developing.

TSLA - Tesla: Alright, stepping away from healthcare for a moment. Tesla has obviously been on a stellar run, and I had shared the chart with subscribers many times, prior to this recent rally. But now, we find ourselves sitting right above the horizontal resistance zone, which is the same level price failed to hold the breakout on back in December of last year. If you look at the weekly chart below, you will see it a bit more clearly. Now if you look at the daily chart, you can see it forming a mini consolidation right above the 21 EMA. As long as this can hold above that support line, I think we can potentially setup another move higher from here. First target would be those former highs are $480 area. And obviously if we can clear that level, the sky is the limit.
TSLA - Daily Chart:

TSLA - Weekly Chart:

Thank you for tuning in as always!
Have a great week.
Together We Trade