- Together We Trade
- Posts
- Charts To Watch!
Charts To Watch!
Noah
December 15, 2024
Hello Traders,
Hopefully everyone had a good week and is enjoying a couple days off!
Here’s a quick look at where the major indexes landed to finish the week:
QQQ | +0.77% |
SPY | -0.59% |
DIA | -1.74% |
IWM | -2.45% |
There are definitely a few signs which err on the side of caution. We are seeing an expansion in 1 month & 3 month lows, and net new lows for the S&P500. The Advance decline line has started rolling over for the past 2 weeks as well. The S&P500 is still sitting relatively close to all time highs, but has definitely started to consolidate. These are all great data points to consider, but, it’s important to remember that we are in a bull market. And this has happened several times within this bull market, and we’ve continued to resolve higher. Within bull markets, It is normal and healthy to have pull-backs, and for money to rotate.
Breadth Outlook - S&P500 (1 month lows, 3 month lows, net highs/lows, ADX line)

When you look at the RSP chart which is the equal weighted S&P500 Index ETF, we’ve already seen an almost 3.5% decline off the highs. This helps put context on where we actually sit in the market. We’ve seen large caps rally strong over the past couple of weeks, which likely is helping hold the cap weighted indexes at higher ground, but truthfully there has already been pull-back taking place within the market. If you look at the daily chart of the RSP, it’s testing the 50 day moving average as we speak, and price has basically been falling for 2 full weeks. When you look at the weekly chart below, we are pausing right at the 1.618 fibonacci extension level. Seems like a logical level for a pause to occur. As I scan the market, there are quite a few charts that look good technically and have formed nice bases, but are now in the process of forming consolidations right around logical resistance levels. So, the argument is, is this just a healthy and normal pull-back within a bull market, which will ultimately help setup these charts for new trades, or will it transpire into something more. We will have to wait and see, but I wouldn’t be putting all my eggs in the “end of the bull market” basket given the context of things.
RSP - S&P500 Equally Weighted Index ETF

Let’s get into this weeks charts!
CCAP - Crescent Capital: Forming a multi-year cup & handle pattern. Clean breakout over resistance. First target the blue line, then ideally if the market gives it, a breakout to new all-time-highs.

ADUS - Addus HomeCare: Multi-year base, with an attempt to breakout over resistance which failed. As of right now, price looks to be forming a consolidation, which could turn into the handle of a multi-year cup & handle pattern.

BYD - Boyd Gaming: Multi-year base breakout. Price is tightly trading just over resistance. As long as it holds above resistance I’m bullish this chart.

FRT - Federal Realty Investment: Multi-year bottoming base in the works. Price trading right along resistance as it looks to be consolidating before pushing up into the right to complete this massive base.

EPRT - Essential Properties Realty Trust: Massive multi-year base. Price is consolidating right along resistance which looks to be acting like a potential new support zone. Watching for price to begin curling upward to signal a new leg higher.

CMRE - Costamare: Multi-year head & shoulders pattern in the works. Price looks to potentially be forming the right shoulder as we speak. I want to see it hold this level and resolve higher. This potentially offers a good risk/reward trade.

ASTS - AST SpaceMobile: This 5 month base looks to only be about half way complete. I’m watching this closely to see if we can begin curling upward and complete the right side of this base. Definitely a higher beta name, so risk has to be managed properly.

REG - Regency Centers Corp: Multi-year cup & handle pattern in the works. Price is trading just under long standing resistance line. Watching for a breakout over the line to signal a new leg higher.

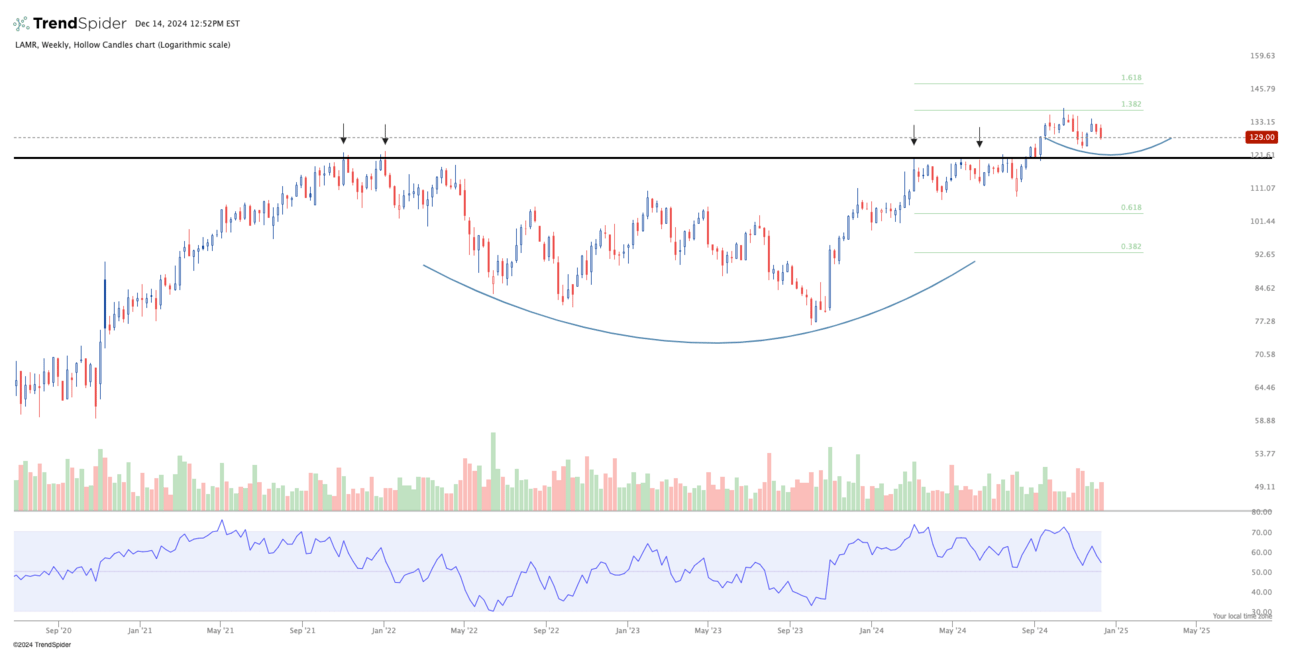
LAMR - Lamar Advertising: Multi-year base/cup & handle breakout, followed by a very normal and healthy consolidation within an uptrend. This could trade all the way back to the support line before bouncing. But watching this for a pull-back entry opportunity.
SCVL - Shoe Carnival: Multi-year cup & handle pattern. We are right at the lower end of what I am anticipating to be the handle of this pattern. This could be offering a great risk/reward opportunity at this level if this can resolve higher.

COIN - Coinbase: Still working on the right side of this massive multi-year IPO base. Heavily correlated to what Bitcoin is doing, so paying attention to both assets. However, as long as this holds its support zone I like it.

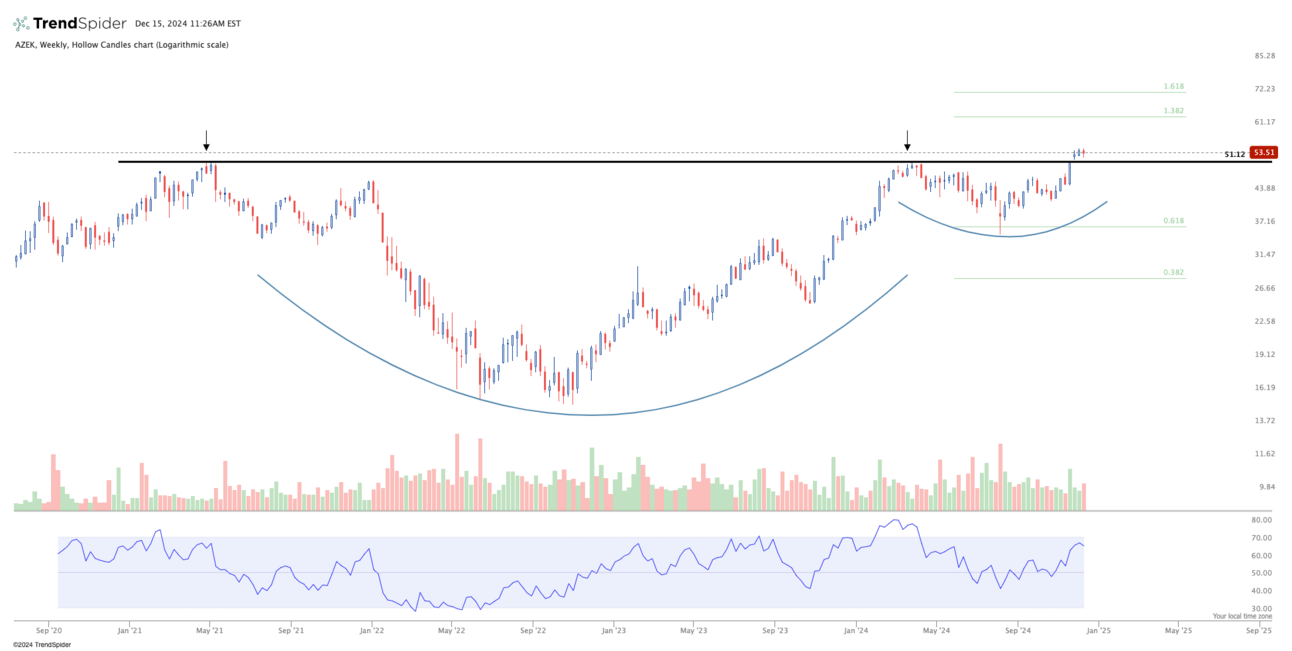
AZEK - The AZEK Company: Multi-year cup & handle pattern with a clean breakout. Tightly trading right above support. As long as it holds over this zone I am bullish on this chart.
GOOGL - Google: Aggressive move in google last week. It attempted the breakout of this multi-month base, but tucked back under resistance to close the week. I definitely think some consolidation would be normal, however, I am watching it’s price action closely.

CPNG - Coupang Inc: Multi-year bottoming base formation with a breakout/retest of support. As long as this support zone holds, it could potentially offer a solid trade opportunity if this resolves higher.

INTU - Inuit Inc: Super clean multi-year cup & handle pattern. Price trading just under resistance. Looking for the breakout above the line to signal the next leg higher.

GIII - G-III Apparel Group: Multi-year cup & handle pattern. Price likely needs some consolidation before pushing higher, but nonetheless, chart looks great and is on watch for a breakout.

INFY - Infosys Limited: Multi-year base in the works. Price looks to be actively working on completing the right side of this massive base. Looking for a breakout of this mini consolidation to signal the next leg up.

There you have it folks. I’m definitely thinking more defensively given the recent breadth data. However, I am also watching to see what rotation potentially occurs under the surface, as this is what happens in bull markets. The coming weeks will certainly paint a more clear picture of what to expect going forward, but regardless, there are still lots of strong charts out there.
Let price dictate all decision making.
Have a great week!
Together We Trade