- Together We Trade
- Posts
- Charts To Watch!
Charts To Watch!
Noah
July 27, 2025
In partnership with
“Big Plastic” Hates Them

From water bottles to shrink wrap, Timeplast has a $1.3T market opportunity with its patented plastic that dissolves in water. But the clock is ticking to invest. You have until midnight, July 31 to become a Timeplast shareholder as they expand globally.
This is a paid advertisement for Timeplast’s Regulation CF Offering. Please read the offering circular at invest.timeplast.com.
Hello Traders,
The S&P500 closing at new highs.. again. Nasdaq closing at new highs… again. Even the equally weighted S&P500 (RSP) and Nasdaq-100 (QQQE) closed at new highs. This market has been relentless. I will keep playing ball until we get fouled out. I say every time that a consolidation would be healthy. We’ve yet to get a real consolidation yet and this has been a massive bull run. We will at some point. But best not to fight the trend. What we are seeing is rotation. And this is a very good sign. New areas of the market are stepping in, fuelling the upside. This is healthy and likely part of the reason we haven’t seen as much of a consolidation. Money has just been rotating into new areas. The lifeblood of a bull market as I’ve once heard.
TICKERS
SERV, CDNS, PATK, CEG, FOX, SPGI, DE, BSX, RPRX, HSAI, GLD, SCCO, HNRG, GS, BWTX
Let’s get into this weeks charts!
SERV - Serve Robotics (Daily chart): This chart had a strong rally off the lows in May. Its now formed multi-month consolidation. Looks like its trying to form a mini-base, with the 200 day MA and 50 day MA just under price. I’m hoping those MA’s can help provide some additional support to price and give it a life. I want to see it push through that slanted resistance line to signal the next leg higher.

CDNS - Cadence Design Systems (Weekly chart): Nice year long base formation. Price has tested that upper resistance zone several times over the past year and as of last week, it looks like it’s trying to push above it. Earnings are tomorrow, so its tough to say how this will play out, but if the reaction is positive then this could setup a good trade opportunity. We will want to see price hold above the line moving forward.

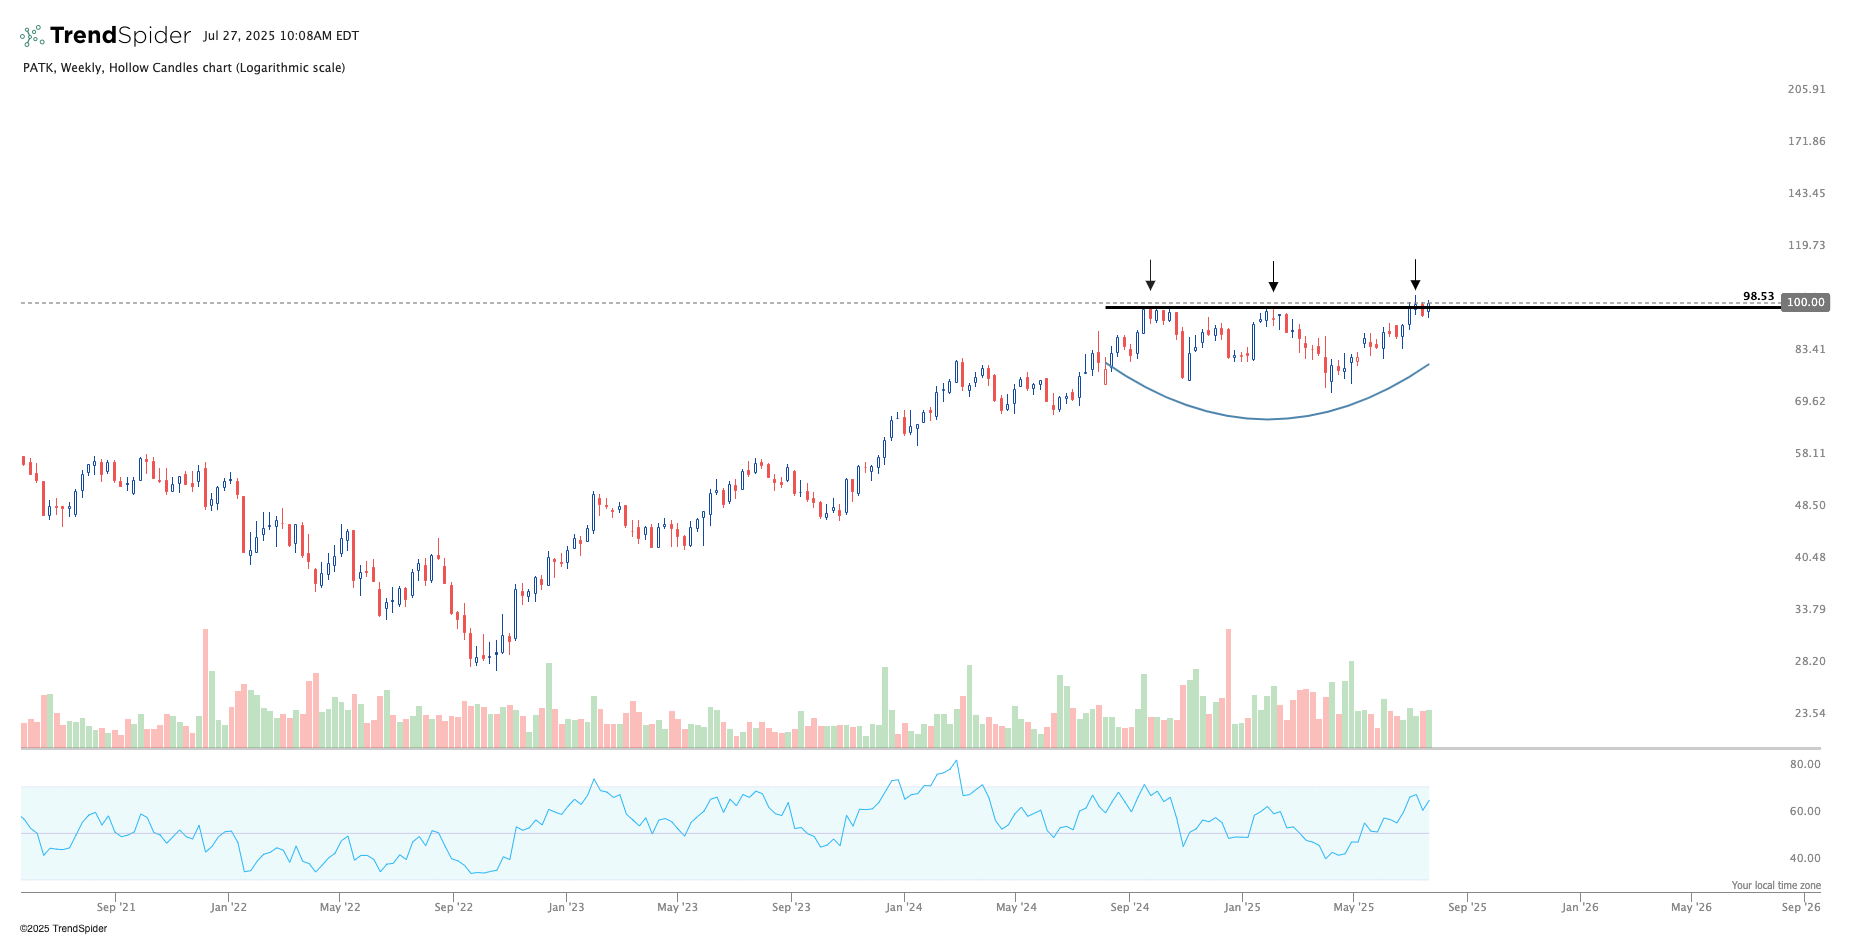
PATK - Patrick Industries (Weekly chart): Almost a year long base formation in the works. The past 3 weeks, price has tightly consolidated right at that resistance line. Looks like it’s trying to break above it as we speak. We do have earnings coming up, so once again, we have remain cautious until earnings are out of the way. But overall the chart looks to be setting up for a break above resistance and continuation to the upside.
CEG - Constellation Energy (Daily chart): Big cup & handle formation building here. We have a big base, followed by a smaller tighter consolidation (handle). The rising 50 day MA is just under price, which I hope will provide some additional support to price. I’m looking for a breakout above the line. This resistance line has been tested several times, and has had a couple week attempts to push above it, which failed immediately. Keep in mind, earnings are on August 7th.

FOX - Fox Corporation (Daily chart): Repeat name here. We have a big base formation here. There is a well defined resistance zone which price is starting to push up against as we closed last week. The rising 50-day MA is just under price, which has also acted as support on a couple mild pull-backs within this consolidation. I’m looking for a breakout above the line to signal the next leg higher.

SPGI - S&P Global (Weekly chart): Shared this one last week. We have a well defined resistance zone and a nice base formation. We have the rising 50-week MA which is acting as support on the most recent pull-backs within this base. Price looks to be tightening and now trying to push through resistance. Earnings are next week, so we have to be cautious until that release is out of the way. But all in all this is setup nicely for a continuation to the upside.

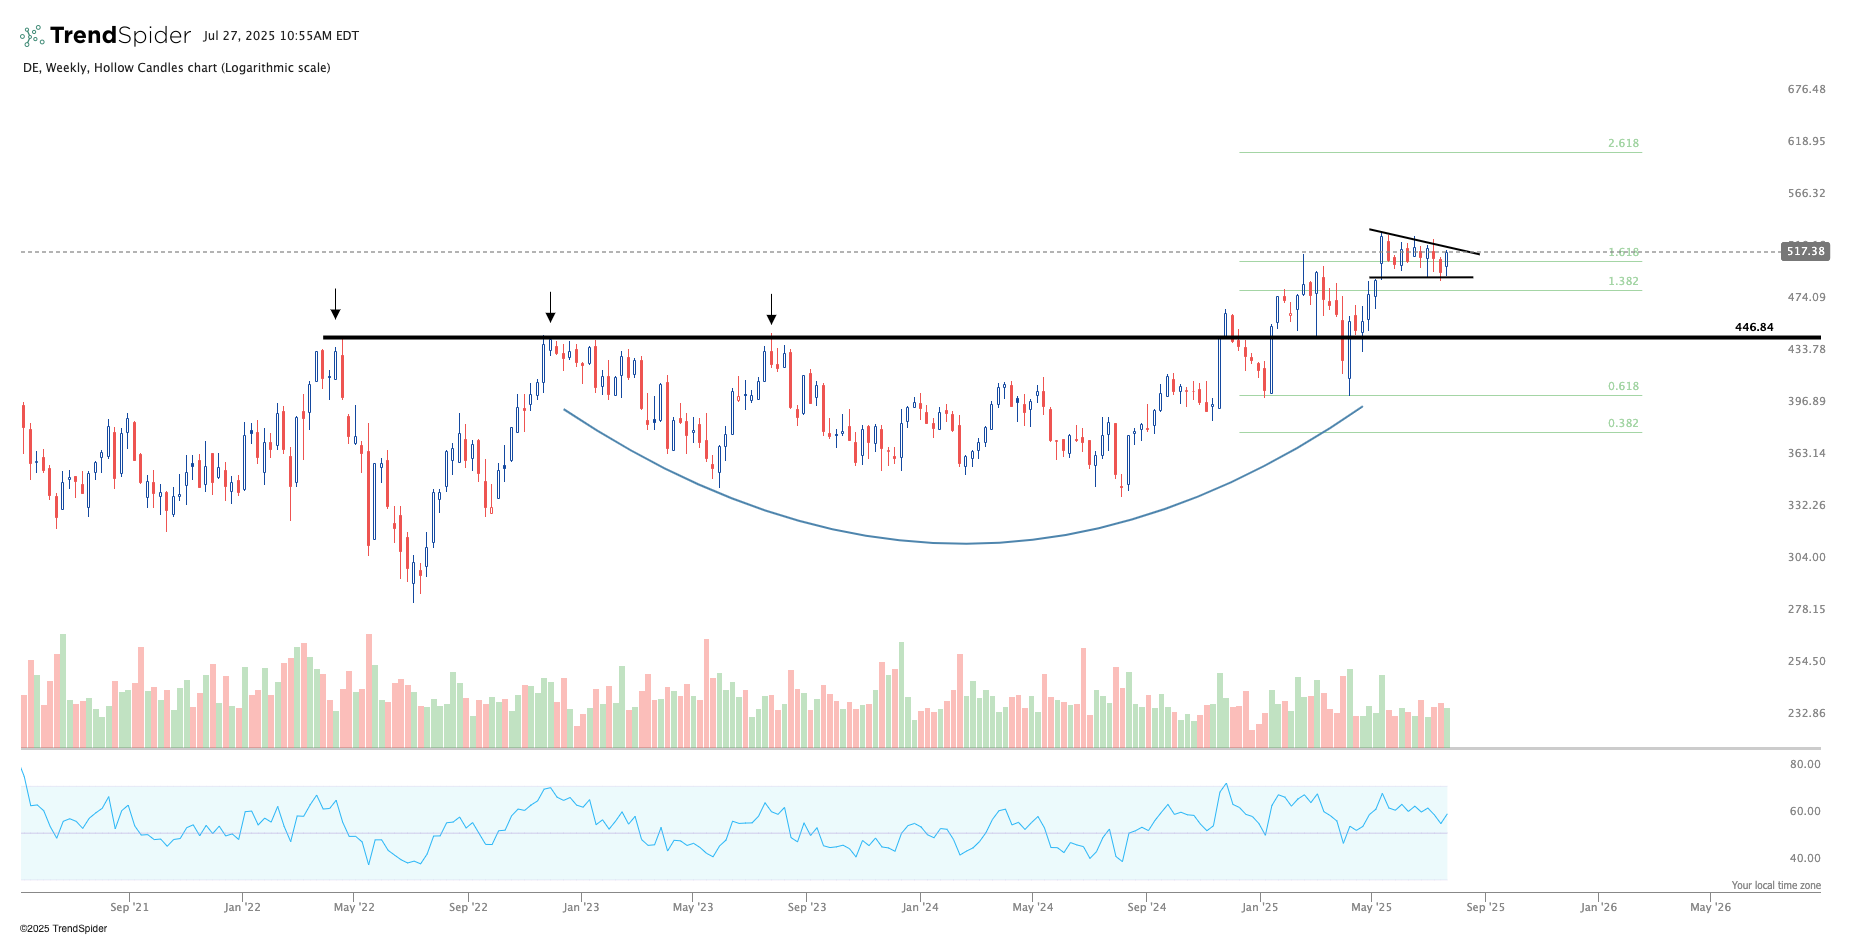
DE - Deere & Company (Weekly chart): This chart looks to be setting up for a continuation to the upside. It had formed a multi-year base formation, which price managed to break out of. It was a bit of a choppy start, but ultimately did get the breakout and rally. We are now forming a tight consolidation which has been developing for a couple months now. On the daily chart, price has just reclaimed the 50-day MA. I want to see this start to push out of this consolidation pattern as I believe that would signal the next leg higher.
BSX - Boston Scientific (Daily chart): I shared this chart several times now. We got the push up to the prior resistance zone following a positive earnings reaction. It hasn’t been able to hold above that resistance zone yet, but given earnings are behind us, and the reaction was more positive, I think this may just need a little bit of time to digest the news and hopefully begin to grind higher. Once we clear that resistance zone, I would expect this to have a lot more room to move higher.

RPRX - Royalty Pharma (Daily chart): This name continues to grind higher. It broke out of a nice multi-month base in June, rallied for a couple weeks, and now it’s forming a smaller consolidation pattern. It looks like its trying to push up and out of this consolidation as we speak. As long as it can stay above that upper black resistance line I like it for a continuation higher.

HSAI - Hesai Group (Daily chart): I’ve shared this chart previously as it looked like it was about to breakout to new all time highs. Unfortunately it wasn’t ready, and has since pulled all the way back into the 50-day MA. This 50-day has acted as support the past week and I hope it continues to do so. You could either take an entry right here at the 50-day and have a stop below it, which would have very limited downside risk with a lot of upside potential, or wait to see if it wants to take a second attempt at pushing back above the line. This is a higher beta name so position sizing has to be adjusted accordingly.

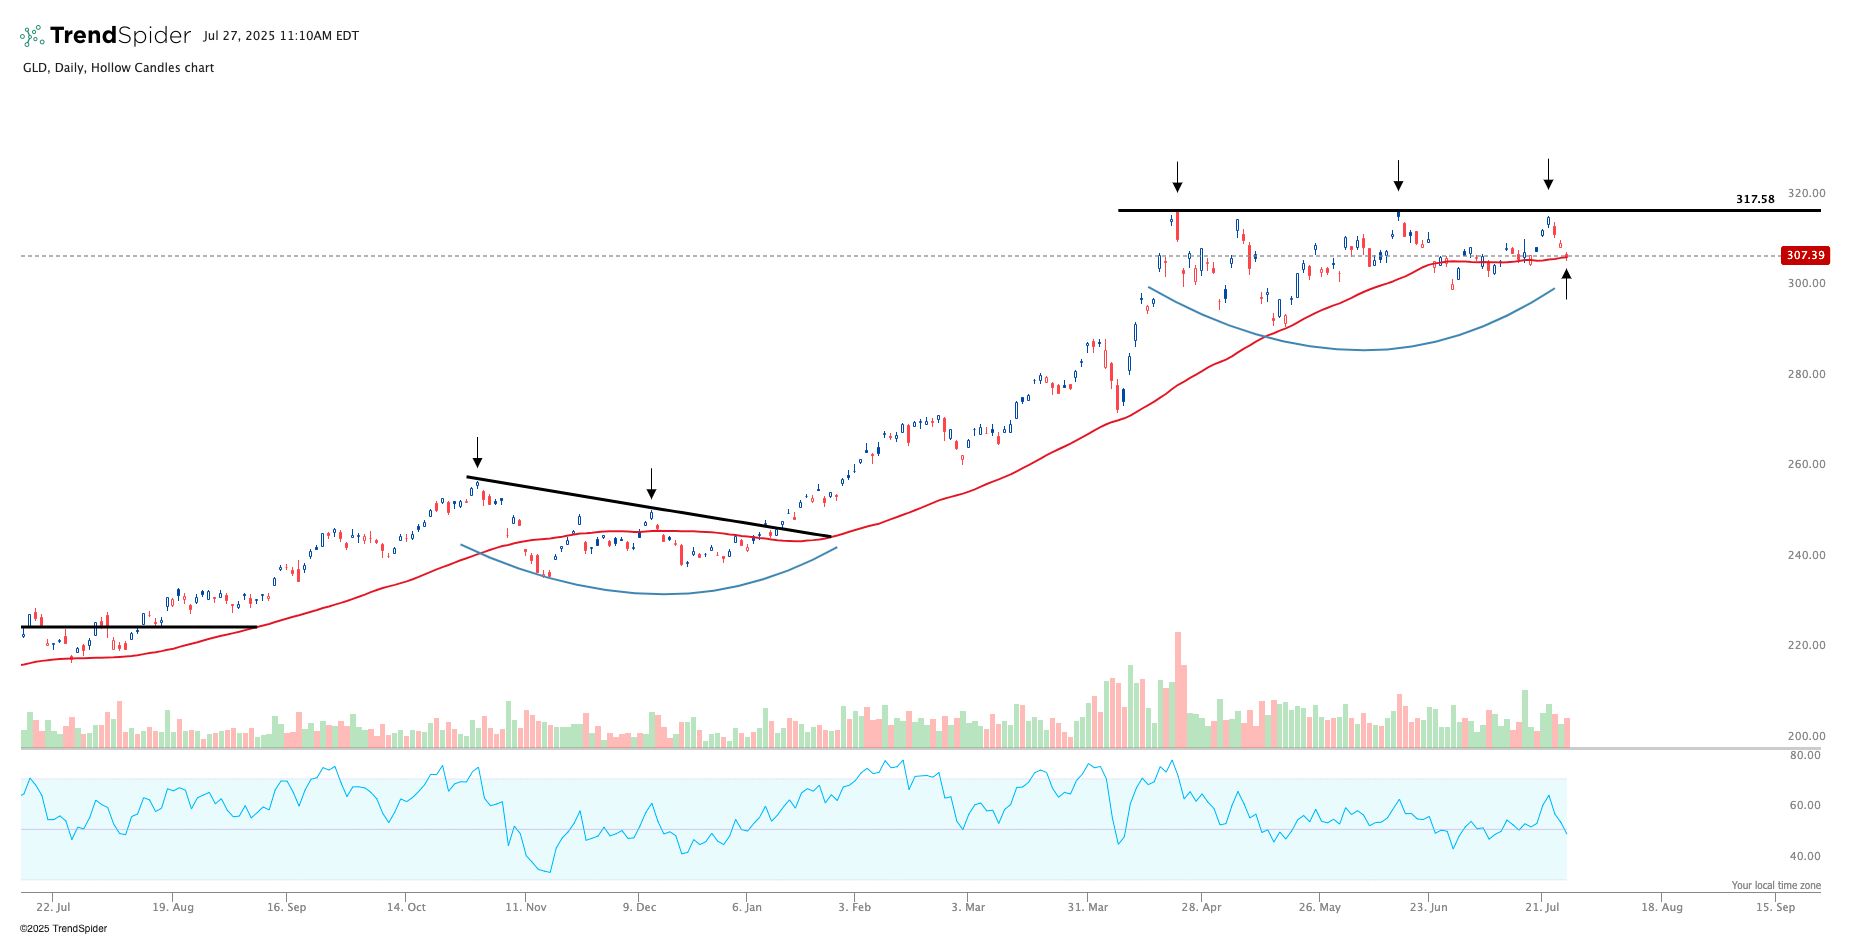
GLD - Gold Trust (Daily chart): We are at the do or die point for gold.. sort of. Gold is in a monster of an uptrend, and has formed a nice base consolidation since April. We have a well defined resistance zone above, and now price has pulled right back into the 50 day MA. If the trend is to continue as it has, I would expect a pop off the 50-day and for it to resume trend. It’s always possible that further consolidation is needed, especially given the massive upside gold has seen. Regardless, if price decides to firm up at the 50-day I will likely take a low risk to reward entry down here, with a stop somewhere below the 50-day.
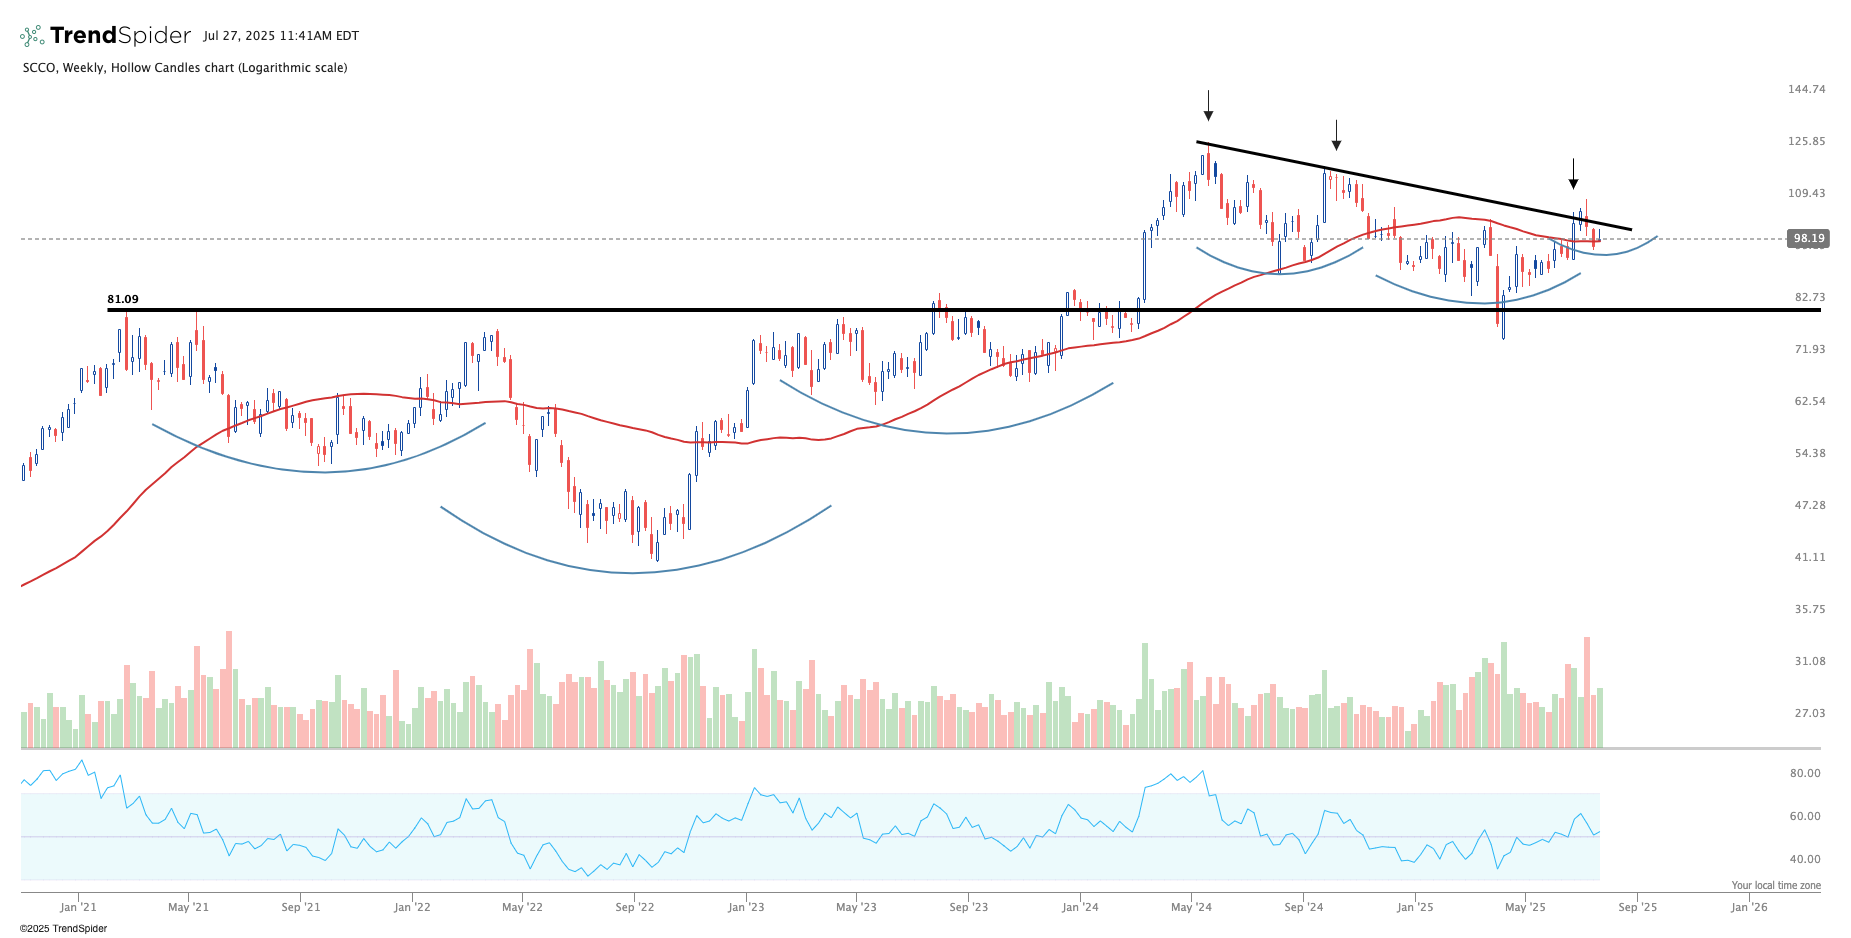
SCCO - Southern Copper (Weekly chart): While copper prices are testing all-time-highs, the stocks themselves have been average at best. However, Southern Copper looks like it may be setting up for a continuation to the upside. After the monster move it had back in March of 2024, it’s been in a long consolidation/pull-back. Its developed a pretty clear slanted resistance line as it’s been pulling back. I tried to push above this line a couple weeks back but failed. Its now sitting right on the 50-week MA, which I’m hoping will hold as support. I’m keeping this name on watch for a second attempt. The initial breakout attempts often fail, but the second attempts, if we get them, are usually more meaningful. On watch for now.
HNRG - Hallador Energy (Weekly chart): I really like the look of this chart. Big cup & handle breakout on the weekly chart, followed by a quick rally, and now we are forming a mini-base above that resistance zone. Still some price confirmation needed, but last week, it did get a pretty nice push back above the 50-day on the daily chart, but unfortunately closed below it to finish the week. But it was nice to see price make an attempt at higher prices. Regardless, as long as this holds above the black resistance line I like it. It may need to churn a bit longer before resolving to the upside if a continuation is in the cards.

GS - Goldman Sachs (Daily chart): Massive base breakout, followed by a smaller consolidation which looks to be setting this name up for a continuation to the upside. Earnings are out of the way as well which is great. I would be looking for price to meet the next fib extension 1.382 as the next target.

BWTX - BWX Technologies (Daily chart): Massive base formation, followed by a breakout, and then a new consolidation formation. Price posted a solid breakout above the new resistance zone on this mini consolidation pattern on Friday, and looks like it wants to continue to the upside. Next target would be that 1.382 fib extension line around $156. We’ll have to reassess after it meets that level, given this continues to follow through.

Have a great week everybody!
Together We Trade