- Together We Trade
- Posts
- Charts To Watch!
Charts To Watch!
Noah
December 29, 2024
In partnership with
Man Who Called Nvidia at $1.10 Says Buy This Now...

This company signed a major deal with Apple
Nvidia has invested more in this one company than any othe
And its tech is found in products from Samsung and Google
Hello Traders,
Hope everyones enjoying their weekend. Last week was a bit of sprint with a shortened trading week. We managed to finish green on all the major indexes, but definitely had some selling pressure on Friday to close the week. Definitely not the Santa Clause rally we all had hoped we were getting for Christmas, but it is what it is. We have two trading days left in the year, maybe we are pleasantly surprised… Here’s where the indexes finished the week:
SPY | +0.65% |
QQQ | +0.75% |
IWM | +0.21% |
DIA | +0.34% |
Subtle improvement in breadth under the hood. Less stocks making new 1 & 3 month lows, and slight uptick in stocks making net new highs vs new lows. It feels like the indexes still have some work to do, but that doesn’t mean certain stocks can’t still move higher. It’s still a bull market and all of what we are seeing is still normal amidst bull markets. Let’s not forget that. Things can always change, and maybe they will, but we need to look at whats in front of us.

Many of the charts below are consolidating after testing previous highs. Some look to be forming handles of cup and handle patterns, and some are sitting at breakout levels. I personally like positioning myself within names with a strong weekly chart which are in the process of consolidating after testing the previous highs. If these charts play out as anticipated, positions end up in the green much quicker, and give well defined risk levels to trade against. It does take some time to get the pattern recognition down to see the subtle characteristics in the pattern to pick these spots.
Tickers:
RERE, AR, SRUUF, ARLP, BYD, BMO, BYDDF, CET, CNP, AB, SPGI, HD, MORN, GFL, CCAP, AFG, TDY, INTU, KWEB, CDNS, UHAL, ADUS, SCVL
Let’s get into this weeks charts!
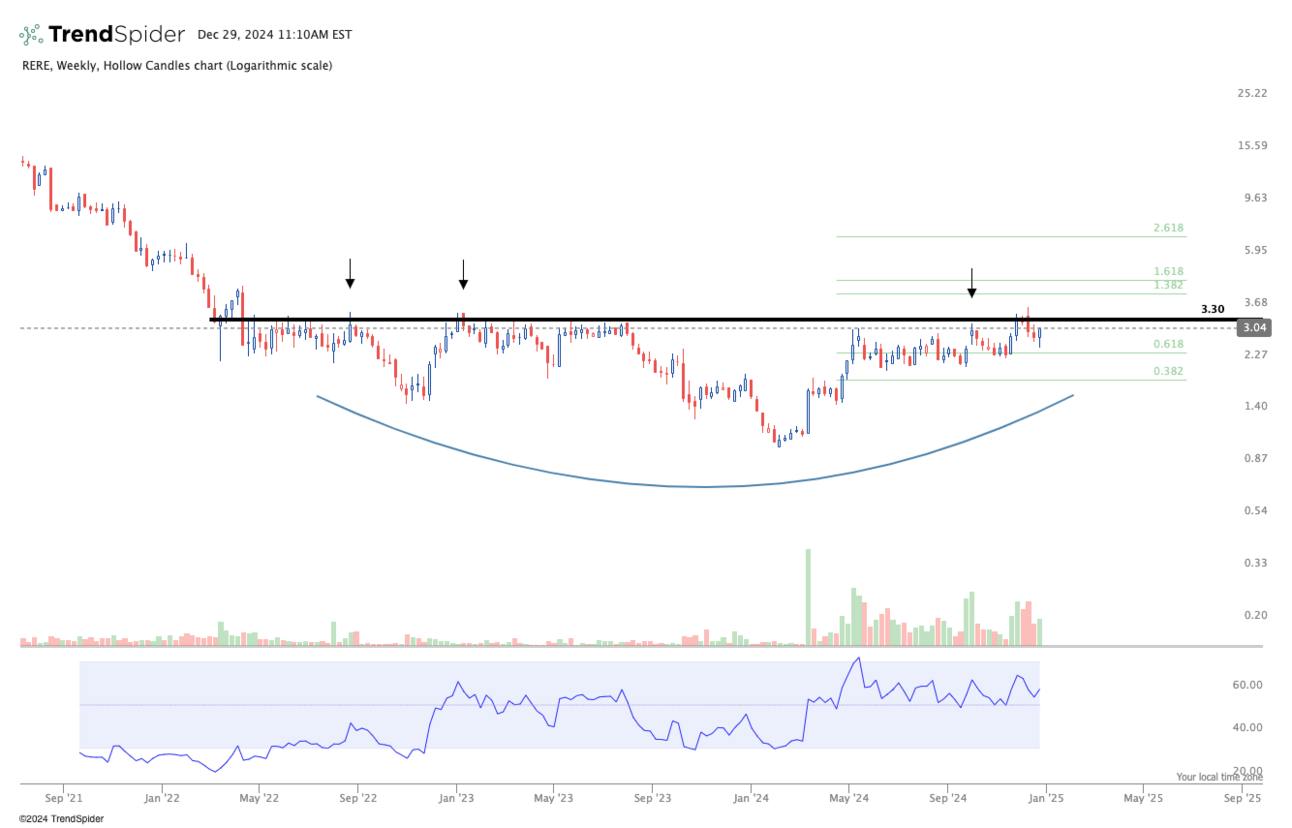
RERE - ATRenew Inc: Nice bottoming base forming. Price attempted to breakout a few weeks ago but failed. Trading just under resistance right now. Watching for a second breakout attemp.
AR - Antero Resources: Looks like the right side of a big base is forming. I want to see price get over the line to really show me it wants to move higher. We are trading just above the 50 week moving average. I’m look at that level as a bit of a support zone as we move forward.

SRUUF - Sprott Physical Uranium Trust: Uranium has been underwhelming. But we are trading at an important level for the physical uranium trust. Either we breakdown and its game over, or this line holds and offers a great risk/reward opportunity. What I’ve been reading lately is centred around the large demand coming in for nuclear energy to support the AI movement. A part of me has a hard time thinking this will break down, but we will have to wait and see. I’m probably most interested in how this chart will play out over any other chart on this watchlist.

ARLP - Alliance Resource Partners: Nice big base, tight consolidation forming after testing all-time-highs. Looking for this to give an uptick to signal this wants to test the breakout for a second attempt.

BYD - Boyd Gaming Corp: Broke out of a massive base, but quickly tucking back under the line. Looks like it wasn’t quite ready for the breakout, so I’m keeping this on watch to see how this consolidation plays out. I will keep a close eye on this for a second attempt in the coming weeks.

BMO - Bank Of Montreal: First breakout attempt failing, but I’m watching closely for a second attempt. Definitely feel the market pressure interfered with this attempt to push higher. I will let it consolidate for now, and watch for signs of price wanting to test higher in the coming weeks.

BYDDF - Byd Company Limited: Love this chart. It tested those highs, then pulled back and is now putting in what looks to be a bit of a handle in a large cup & handle pattern. This is a chart I would consider buying right here, and have my stop under the recent lows. If it fails, small loss, but if it curls higher, there is potential for a strong move.

CET - Central Securities: I shared this chart when it broke out over the line. It’s now doing what many stocks do, and is retesting that breakout level. If this level holds then it offers a break risk/reward opportunity. Risk is well defined, because if it breaks below that line, all bets are off.

CNP - CenterPoint Energy: Shared this one last week. Price continues to consolidate right under resistance. For this chart specifically I will wait for the breakout. The consolidation isn’t deep enough after testing those highs, for me to buy the pull back. I will be waiting for the breakout.

AB - AllianceBernstein Holding: Potentially massive base being formed here. Starting to curl up after coming consolidating for several months. If this holds this line, I am very interested in the possible potential in this chart.

SPGI - S&P Global Inc: I shared this one months ago as it was forming the handle of this massive cup & handle pattern. A good example of buying the consolidation within a much larger pattern. It broke out and is now once again testing the breakout level. As long as it’s over this line I like this chart.

HD - Home Depot: Break out failed on this massive base. Looks like it needs to consolidate for a bit before maybe giving a second opportunity. Watching closely for an opportunity to enter within this consolidation. Likely needs a few more weeks to shape up, but keeping on watch as things can change quickly.

MORN - Morningstar: Another chart I shared months back while this chart was still forming the right side of this massive base. We now had the breakout over the line, but quickly failed. I think this needs some time to consolidate and build up enough momentum to continue higher.

GFL - Environmental Inc: Big base breakout, followed by a retest of the breakout level. I’m watching to see if this line will hold and hopefully give continued upside.

CCAP - Crescent Capital BDC: This chart broke out a few weeks ago, and is now tightly consolidating just above resistance. As long as this line holds I really like this chart right where it sits.

AFG - American Financial Group: Big base pattern which price tested those highs, but quickly pulled back. I’m watching this consolidation for signs that it’s finding support and wants to take a second shot at those highs.

TDY - Teledyne Technologies Incorporated: This is a monthly chart. I don’t do monthly charts as often, but I felt this particular chart shows a lot of potential. Massive move in this stock for years, followed by a multi-year consolidation and now price is breaking out over resistance. This chart is high on my list for a continuation to the upside.

INTU - Intuit Inc: I’ve been sharing this chart for weeks. It continues to consolidate in a very orderly fashion after failing the first breakout attempt. Looking for an uptick in price to signal this wants to attempt a second breakout opportunity.

KWEB - CSI China ETF: Shared this chart weeks ago. Price continues to consolidate after failing the first breakout attempt. I’m very interested as long as this doesn’t take out the recent lows. We currently sit right around those lows, so I’m hoping we get a bit of an uptick to signal a second attempt at those recent highs.

CDNS - Cadence Design Systems: Nice big base forming over the past year. Price has tested that upper resistance line 3 times. I’m watching this consolidation to see if price can start to curl up and signal to me it wants to test those highs again.

UHAL - U-Haul Holding Company: I’ve shared this chart for months. Consolidating after testing all-time-high. I personally like where this chart sits right here. Risk can be placed below those recent lows over the past couple of months.

ADUS - Addus HomeCare Corp: Price consolidated after attempting to breakout to new highs, and recently popped back up to test those highs again. Currently trading right under resistance. Looking for a breakout in the coming weeks.

SCVL: Shoe Carnival: Big cup & handle pattern. Price pulled back after testing those highs, and is forming a really nice consolidation. Price looks to be firming up and starting to show early signs that it may want to start curling higher. High on my watchlist.

Thanks for tuning in!
Have a great week, and solid New Years Eve. We have another shorter week ahead of us. As always, let price tell you when to act and when to wait.
Happy New Year to everyone if I don’t put out a market update before we enter 2025! I appreciate all of you who have subscribed to this newsletter. It’s been a lot of fun to do, and has personally really helped me keep a good pulse on the market, while also hopefully helping others generate some good ideas within this market.
All the best,
Together We Trade