- Together We Trade
- Posts
- Charts To Watch!
Charts To Watch!
Noah
June 22, 2025
Hello Traders,
I hope everyones enjoying the weekend!
Quick recap from last week. The markets are struggling slightly. It’s not completely unexpected that we’ve met some resistance given the run the markets have went on. I definitely thought some kind of a technical pull-back was on the table, which appears to be happening ever so slightly. We’ve managed to pull-back into the rising 20-day moving averages on the Nasdaq and S&P500, which is a mild pause to say the least. But to make things a bit more complicated we now have escalating conflicts with Iran and Israel and now the United States has gotten involved which I expect to weigh on the markets. The futures markets will open this afternoon, and we will get an accurate idea on how the markets are digesting this news. At the end of the day, we need to trade price and not headlines. If the markets open lower and continue lower, then we need to listen and be defensive especially since we are already seeing a slight pull-back throughout the indexes. If the markets open higher, and don’t seem to be phased by global conflicts, then we also need to listen and trade the price in front of us.
There a several charts that look great and look to be setting up for breakouts and continuations. My game plan is to let price tell me the real story. I will happily participate in new positions, despite the whirlwind of headlines around us, given price is showing confirmation. If we don’t see follow through, I sit and wait.
TICKERS
ALLT, WMB, SMCI, SNRE, CNM, NN, RDN, BK, UBER, BYD, MTG, PEG, AZEK, GH, ITRI, RMD, BBUC
Let’s get into this weeks charts!
ALLT - Allot Ltd: Daily Chart - Multi-month base formation. Price managed to fully complete the right side of the base. On Friday it tested the all-time-highs and pulled back. I think this could consolidate slightly before making an attempt at a base breakout. I would like to see it stay above the rising 20-day moving average (orange line) in the meantime. On watch going into next week.

WMB - Williams Companies: Daily Chart - Repeat name. We have a well defined resistance zone in blue. After the last test of the upper bound, price pulled back into the rising 20-day moving average, crossed below it temporarily, and reclaimed it on volume on Friday. I want to see this grind higher from here. On watch for a continuation into next week.

SMCI - Super Micro Computer: Weekly Chart - Price is tightening nicely just under resistance. This is a very volatile name, and can swing in either direction quickly. Regardless, I like this tight coil we are seeing. Looks like price is building up momentum but we need price to give us a bit more confirmation to get involved. On watch for next week to see if we can push out of this coil to the upside.

SNRE - Sunrise Communications: Daily Chart - This is a young name, but its stair stepping higher. After breaking out if it’s IPO base, its formed a smaller base with well defined resistance zone. We also have the 50 day moving average rising just under price. I’m hoping this can give the stock some additional support and potentially help lift this one higher. I’ve also overlaid the 9-day EMA to help gauge momentum. As long as it can stay above these MA’s I could see this pushing up through resistance and give us a fresh breakout.

CNM - Core & Main Inc: Weekly Chart - Year long base formation. Price has tested the upper resistance line 3 times over the year, the most recent being within the past few weeks. It quickly pulled back into the rising 9-Week EMA. A little consolidation may still be needed, but I would like to see the 9-week EMA going forward. On watch for breakout attempt over the coming weeks,

NN - NextNav Inc: Daily Chart - price is trying to push up and out of this bottoming base formation. Its tightly consolidating right at resistance and looks like it may be building up some momentum. First target would be the recent highs of the left side of this base around $18 and potentially a breakout to new highs if the market is good to us.

RDN - Radian Group Inc: Weekly Chart - Price is trying to push up into the right of this basing formation. Price is currently respecting the 9-week EMA and the previous resistance line, which is now acting as support. As long as we can hold above the blue support line as well as the 9-week EMA I like it.

BK - The Bank of New York Mellon: Daily Chart - We had a clean breakout above resistance last week. Price is retracing slightly, but the main objective here is to hold above the black support line which also lines up with the rising 9-day EMA.

UBER - Uber Technologies: Weekly Chart - We continue to consolidate above support after the recent breakout. We are at that do or die point. Very straight forward, as long as price holds above the line I like it. If we start to cross below, all bets are off and it goes back on the watchlist.

BYD - Boyd Gaming Corp: Weekly Chart - After a failed breakout attempt earlier this year, BYD has managed to reclaim the resistance line, which looks to be acting as support. It’s tightly consolidating just above the line, as well as the 9-week EMA. I’m hoping this can start to lift higher from here. If we start to break below the line, all bets are off.

MTG - MGIC Investments Corp: Weekly Chart - I’ve shared this chart several times now. This weekly look is very clean. Nice base formation, followed by a very tight consolidating just above resistance. You can see clearly how the 9-week EMA has caught up to price, and it looks like price is starting to lift off this level. As long as we hold the line going forward, I like it.

PEG - Public Service Enterprise Group: Weekly Chart - Big base pattern followed by a big breakout, and now a full retest of that breakout level months later. We are seeing past resistance act as support, and price is now slowly pushing through that new slanted resistance line I’ve drawn. This looks like this pull-back or consolidation phase has potentially ran its course, and now prices want to continue higher. Straight forward approach here, as long as the lower support line holds, I like it.

AZEK - The AZEK Company: Weekly Chart - This is a name I’ve been stalking for a long time. Price has clearly had trouble getting past this resistance zone, but we are currently trading above resistance, all be it, we are getting a bit of a pull-back last week. As long as it can hold above the line I like it. There has been some good volume over the past weeks/months showing up which is a positive sign.

GH - Guardant Health Inc: Daily Chart - Price is trying to breakout. That resistance level is still holding, but it attempted to push through last week, but tucked back under resistance to close the week. We have the rising 9-day EMA right under price, which price has been respecting. This is on close watch for a breakout next week.

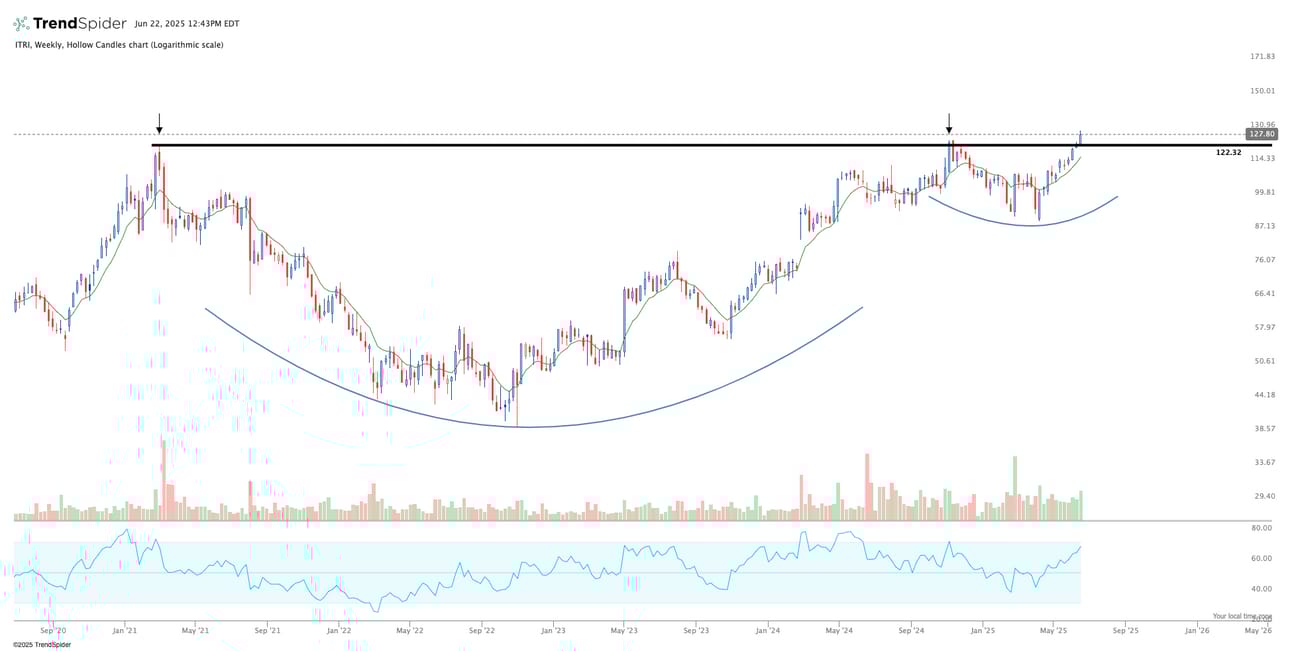
ITRI - Itron Inc: Weekly Chart - Massive multi-year cup and handle pattern. Price put in a clean breakout over resistance last week. Game plan is simple, as long as price can hold above the black line I like it. It’s had a pretty sharp move higher over the past couple months, so a bit of consolidation is very likely before this wants to move higher.
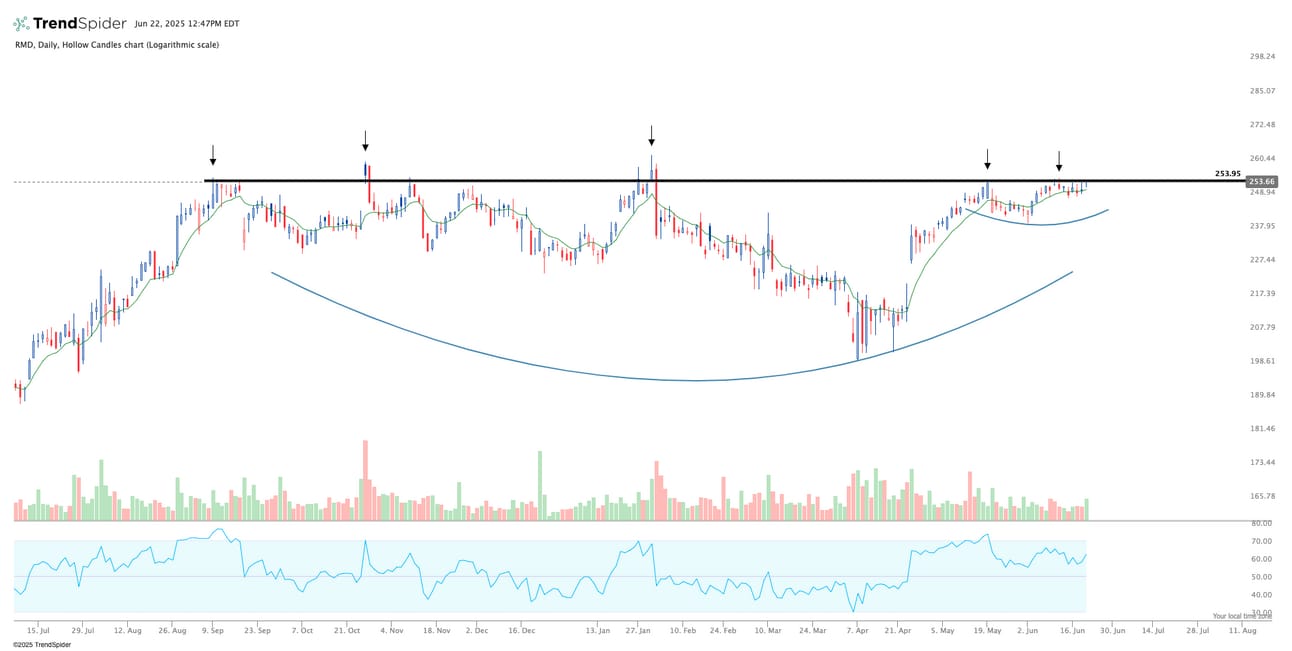
RMD - ResMed Inc: Daily Chart - We have a nice big base pattern, followed by a tighter smaller consolidation right under resistance. This looks to forming a bit of a launch pad for the next leg higher. You can see the 9-day EMA is acting as support right under price. We need price to confirm the breakout, which I’m hoping we will see next week.
BBUC - Brookfield Business Corp: Weekly Chart - Love this bottoming base pattern. Price pushed through resistance, and has essentially consolidated sideways ever since. The rising 9-week EMA is catching up with price and looks like momentum is building. As long as we hold above support I like this chart.

Have a great week everyone. Thanks for tuning in as always!
Together We Trade